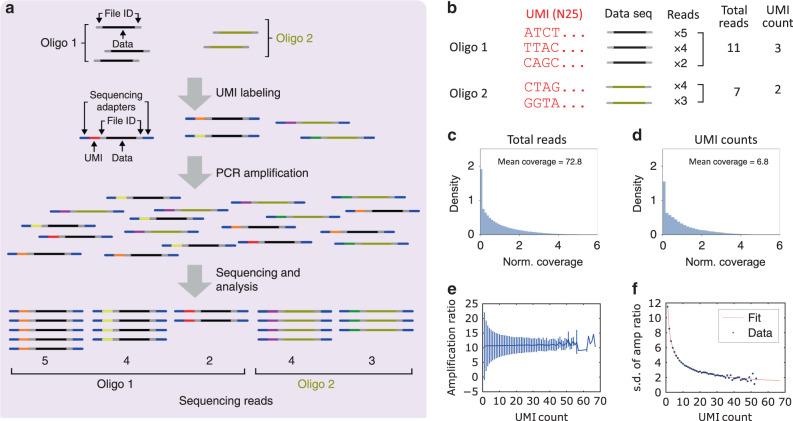
Fig. 2. Estimating oligonucleotide bias using unique molecule identifiers (UMIs).
a Overview of tagging each single DNA molecule with UMIs. Each oligo sequence (e.g., represented in black, beige) in a pool has multiple copies and each copy is labeled with a UMI (represented in different colors) and universal Illumina sequencing adapters (represented in gray). After UMI labeling, oligos are PCR-amplified and sequenced. b Hypothetical examples of UMI counting. The UMI count of each sequence is a proxy for the oligo copy number from DNA synthesis. The total number of reads containing the same UMI is a proxy for the number of copies of a DNA molecule created by PCR. c The distribution of number of reads for each sequence, normalized to 83.0 mean coverage. Read counts are normalized to form a probability density (y-axis); the integral of the probability density is 1 (see “Methods” section). d The distribution of UMI counts for each sequence, normalized to 7.7 mean coverage. The biased UMI count distribution indicates that pools are already biased immediately after DNA synthesis, before any PCR is performed. e Amplification ratio versus UMI count. The average amplification ratio is roughly constant across UMI counts, but oligos with low initial copy numbers show higher variation. The error bars indicate standard deviation (s.d.) of amplification ratio. f Standard deviation (s.d.) of amplification ratio versus UMI count. The experimental data agree with Eq. (1). The number of unique sequences (sample size) is 457,772. Source data are available in the Source Data file.

