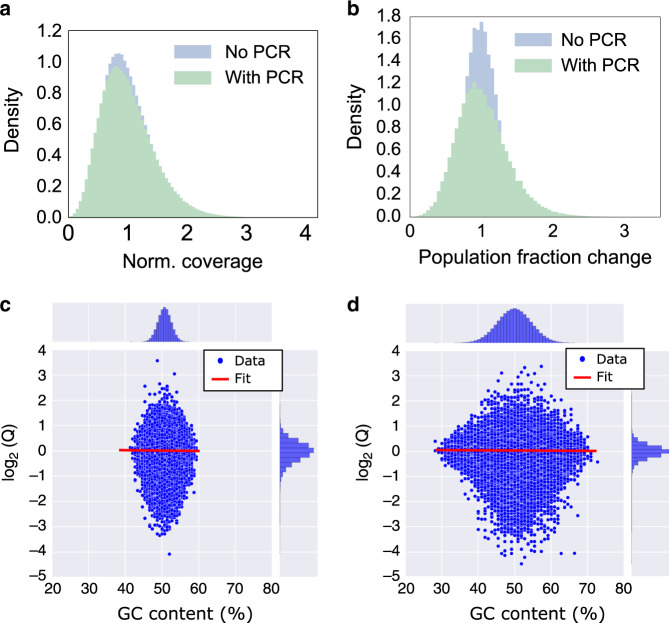
Fig. 4. PCR-induced Population Fraction Changes and Impact of GC content.
a Histogram of sequencing coverages for optimized ready-to-sequence pool. The ready-to-sequence pool was sequenced directly, without PCR (blue). The same pool was amplified using PCR for 31 cycles (green) and sequenced separately. Both were randomly sampled to coverage of 20× for direct comparison, and they look quite similar (c.v. = 0.41 and c.v. = 0.45, respectively). b The blue histogram shows the population fraction change Q distribution of the ready-to-sequence pool, before PCR, after being subsampled to 20x coverage, with respect to its overall available coverage (60×). The green histogram shows the population fraction change Q distribution of the ready-to-sequence pool, after PCR and after being subsampled to 20x coverage, with respect to the pre-PCR pool distribution at 60x coverage. The blue distribution shows the effect of subsampling, while the further widening of the green curve with respect to the blue curve is attributed to stochastic bias in the PCR process. The sample size (number of unique sequences) in a, b is 1,536,168. c, d The GC content is plotted against the log2 of the population fraction change Q for the ready-to-sequence, non-homopolymer pool (c) and a homopolymer pool (d). The experimental data are shown as blue dots, and the linear fit is shown as a red line. The histograms of GC content and log2 (Q) are shown at the top and right, respectively. The sample size (number of unique sequences) in c, d is 1,536,168 and 1,358,998, respectively. Source data are available in the Source Data file.

