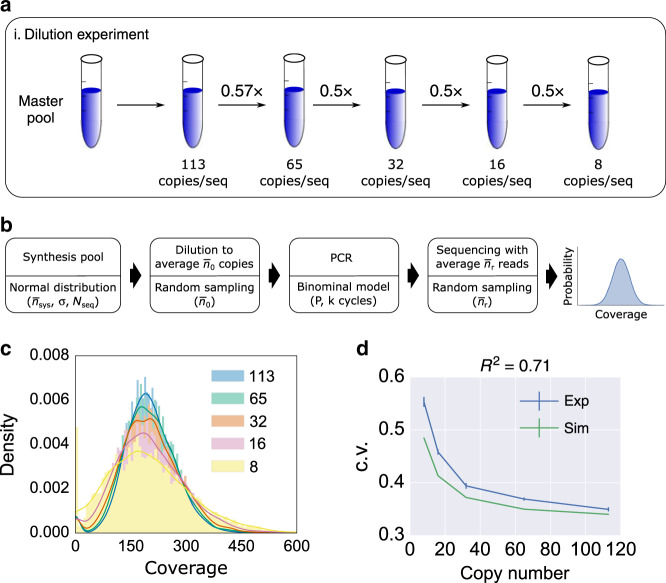
Fig. 5. Dilution-PCR experiment.
a The experimental workflow. A master DNA pool was diluted to different average copy numbers as indicated in the drawing. Each dilution sample was PCR-amplified and sequenced using an Illumina NextSeq instrument, and the results sampled at 200x coverage. b A computational model for the dilution-PCR experiments. The synthesis pool model used Nseq = 7,373 number of sequences, and normally distributed copy numbers with mean = 108, and standard deviation σ = 3.2 × 10⁷. The c.v. of the synthesis pool in this simulation was set to be equal to the c.v. of our ready-to-sequence pool sequenced at mean coverage 17. The dilution process was simulated using random sampling with a mean copy number , ranging from 8 to 113. PCR was simulated as a binomial process with a probability of successful amplification P = 0.95 and 18 PCR cycles. The simulated sequencing result was obtained using random sampling with an average coverage = 200. c Simulated post-PCR sequencing coverage histogram of each dilution-PCR sample. The initial (pre-PCR) average copy number of each histogram is shown in the legend, ranging from 8 to 113. Coverage counts are normalized to display a probability density. A Gaussian estimated density curve is added as an outline of each histogram to help with visualization. d Sequencing coverage c.v. of the post-PCR mix versus average copy number in the pre-PCR mix. The model prediction (green) shows good agreement with the experimental data (blue) with R2 = 0.71. The error bars of experimental data indicate standard error of the mean calculated from triplicate experiments. The error bars of model outputs indicate standard error of the mean calculated from 100 repeated simulations. Source data are available in the Source data file.

