Figure 3.

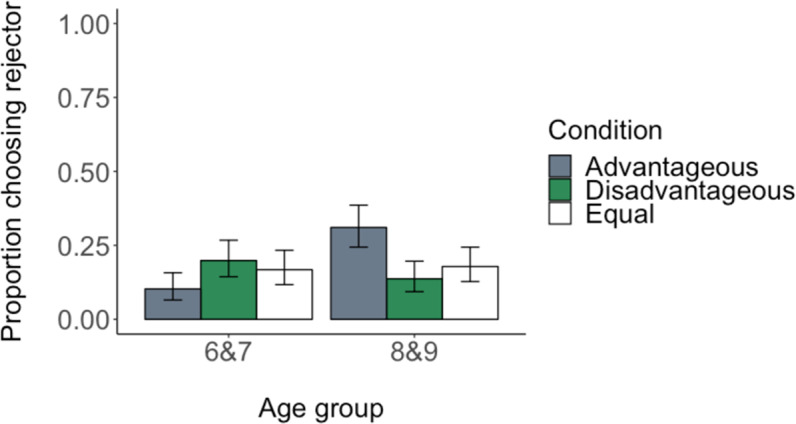
Proportion of trials in which children chose the partner who rejected an allocation across advantageous, disadvantageous and equal conditions. Proportions are shown by age group. Error bars show confidence intervals.

Proportion of trials in which children chose the partner who rejected an allocation across advantageous, disadvantageous and equal conditions. Proportions are shown by age group. Error bars show confidence intervals.