Fig. 3.
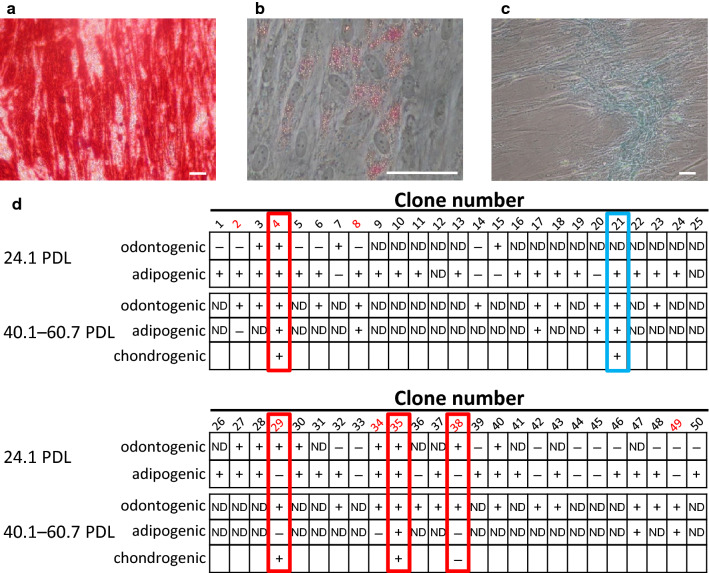
Differentiation potentials of each clone. a–c Representative histochemical stainings of clones. Scale bars = 50 μm. a Alizarin Red S staining for odontogenic differentiation. b Oil Red O staining for adipogenic differentiation. c Alcian blue staining for chondrogenic differentiation (adherent cells). d Odontogenic, adipogenic, and chondrogenic differentiation potentials of each clone at 24.1 PDL and 40.1–60.7 PDL. Eight clones were assayed for odontogenic and adipogenic differentiation potentials at both 24.1 PDL and > 40 PDL (clone numbers indicated in red). Four clones (indicated by red rectangles) maintained their differentiation potentials during long-term culture; CL 21 (indicated by a blue rectangle) was the clone with the highest proliferation rate. + positive, − negative. Some clones were not tested, because they detached from the culture surface (possibly because of overgrowth) during the differentiation period at 24.1 PDL. In differentiation analysis at > 40 PDL, some clones were not assayed, because they stopped proliferating prior to 40 PDL. Some clones exhibited positive staining for Alizarin Red S and/or Oil Red O under the culture conditions with control medium at 40.1–60.7 PDL. The differentiation potentials of these spontaneously differentiated clones were recorded as ‘undetermined’. In the table, ‘ND’ (not determined) indicates clones that detached or stopped proliferation, or spontaneously differentiated

