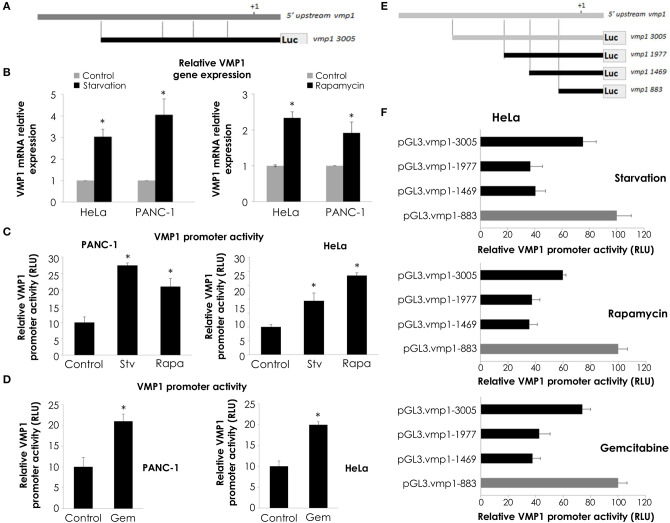
Figure 4.
VMP1 promoter analysis. (A) To assay VMP1 promoter activity, a 3,005 bp sequence of the 5′ upstream region of the VMP1 gene was amplified and cloned into the pGL3 reporter vector (pGL3.vmp1-3005) driving Luciferase (Luc) expression. (B) qPCR assay showed an increase of VMP1 mRNA expression in HeLa and PANC-1 cells submitted to starving conditions and rapamycin treatment for 4 h (n = 3). Next, HeLa and PANC-1 cells were transfected with pGL3.vmp1-3005. (C) Relative Luciferase activity shows an increase of VMP1 promoter activation in HeLa and PANC-1 cells submitted to starving (Stv) conditions and rapamycin (Rapa) treatment. (n = 3). (D) Relative Luciferase activity shows an increase of VMP1 promoter activation in HeLa and PANC-1 cells submitted to gemcitabine treatment for 24 h (n = 3). (E) Consecutive shorter fragments of 3005 bp sequence of VMP1 promoter were amplified and subcloned in the pGL3 reporter vector (pGL3.vmp1-1977, pGL3.vmp1-1469, pGL3.vmp1-883). (F) HeLa cells were submitted to starvation conditions, rapamycin and gemcitabine treatment for 24 h. Relative Luciferase activity showed higher levels of VMP1 promoter activation in the shorter construct (pGL3.vmp1-883) compared to 3,005 bp sequence of VMP1 promoter in all treatments. *p < 0.05.

