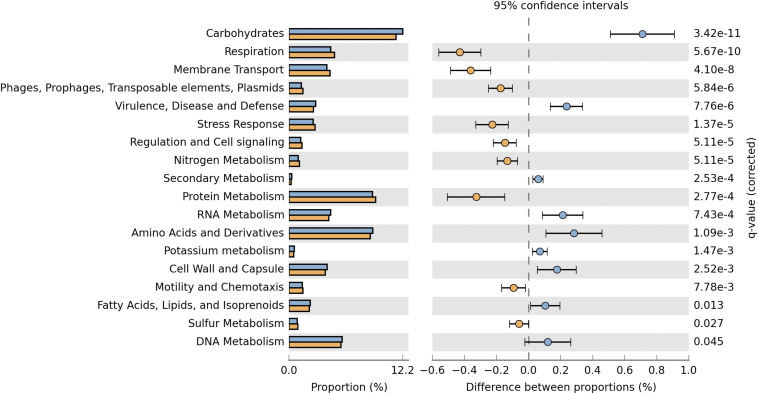
FIGURE 4.
Comparison of the functional profiles derived from the plasmidome (orange bars) and the metagenome (blue bars) of Puquio de Campo Naranja. Percent SEED categorizable protein coding genes and pairwise proportional differences calculated using STAMP. Fisher’s exact test was used and corrected P-values were calculated using Storey’s FDR. Only the statistically significant SEED subsystems are shown (q < 0.05).

