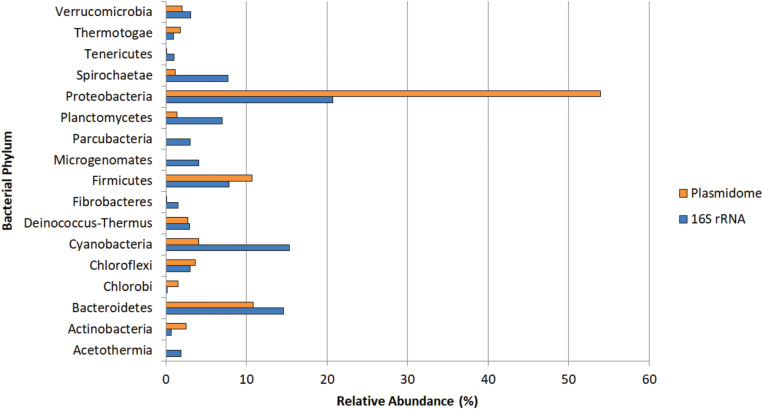
FIGURE 8.
Phylogenetic analysis of the Puquio de Campo Naranja plasmidome at the phylum level. Orange bars show the relative abundance of each bacterial phylum by MG-RAST analysis using similarity to the RefSeq database with a maximum E-value of ≤ 10– 5. Blue bars show the relative abundance of each bacterial phylum by metagenomic DNA analysis using amplicon sequencing of 16S rRNA gene. Phyla that were less abundant than 1% in both datasets were not included.

