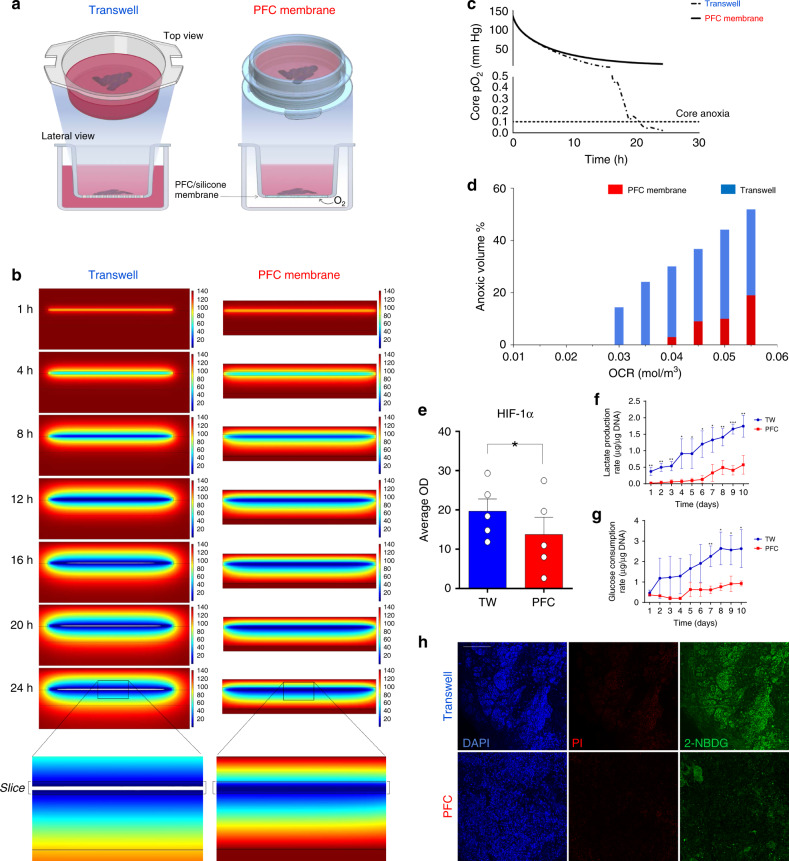
Fig. 1. Enhanced oxygenation of human live pancreatic slices prevents anoxia and preserves oxidative phosphorylation.
a Diagram outlining the perfluorocarbon (PFC) membrane AirHive cell culture dish compared to a transwell dish. PFC dishes are selectively permeable to gases but not liquids. Therefore, medium can be added from the top while air is preferentially transferred directly from the bottom. Graphics partially done with BioRender. b COMSOL modeling of oxygen partial pressure across human pancreatic slices cultured in transwells (left) or PFC membranes (right) over a 24 h period. Spectral scale ranges from high (red) to low (blue) oxygen partial pressure. Anoxic areas are in white. c Partial pressure of oxygen within the core of the slice as a function of time. The dashed threshold represents anoxia. d Total anoxic volume of PFC- (red) and transwell- (blue) cultured slices modeled against increasing oxygen consumption rates. e HIF-1α protein level determination in transwell- vs. PFC- cultured slices after 24 h of culture (n = 5 biologically independent samples from individual donors). Two-tailed t-test: *p-value = 0.0304. f Lactate production rate of PFC- (red) and transwell- (blue) cultured slices as a function of time. n = 3 biologically independent samples from individual donors. Multiple two-tailed t-tests: **p-val1day = 0.0083, **p-val2days = 0.0037, **p-val3days = 0.0056, *p-val4days = 0.0319, *p-val5days = 0.0357, *p-val6days = 0.0111, *p-val7days = 0.0192, **p-val8days = 0.0092, ***p-val9days = 0.0004, ***p-val10days = 0.0009. g Glucose consumption rates of PFC- (red) and transwell- (blue) cultured slices as a function of time. n = 3 biologically independent samples from individual donors. Two-tailed t-tests: **p-val7day = 0.0063, *p-val8days = 0.0167, *p-val9days = 0.0244, *p-val9days = 0.0343. h Representative immunostaining of 2-NBDG uptake (green) during a 10-min incubation of human pancreatic slices cultured in transwells (top) or PFC dishes (bottom), reflecting the higher relative uptake of glucose of the former. Red: Propidium Iodide (PI), indicative of cell death. Blue: DAPI. Scale: 100 μm. b–d represent theoretical computational modeling and have no error bars. In e, data are presented as mean ± S.E.M; in f, g, as mean ± SD. Each n further represents the mean of three technical replicates. Source are provided in the Source Data file.

