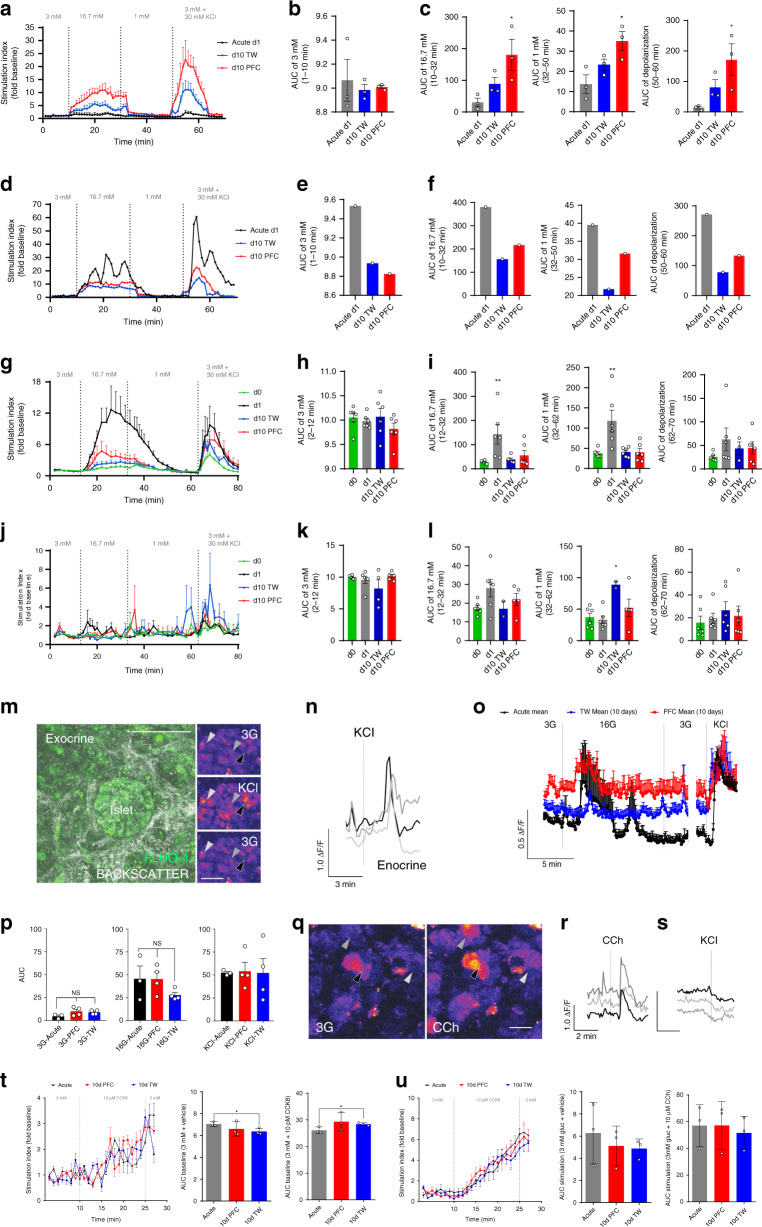
Fig. 3. HPSs retain function after extended culture.
a Perifusion of HPSs after high glucose (16.7 mM, 16 G) and KCl (30 mM) stimulation. X-axis: time/[Glucose]; Y-axis: SI Stimulation Index. Black: acute, day + 1S; red: PFC, day 10; blue: day 10 transwell. b Area under the curve (AUC) at 1–10 min (3 mM glucose/baseline) (n = 3). c Left to right, AUC at 10–32 min (16.7 mM, high glucose); 32–50 min (1 mM, low glucose); and 50–60 min (KCl depolarization). a–c: n = 3 biologically independent samples from individual donors). One-way ANOVA post hoc Tukey HSD: *p-val16.7mM[D1 (acute)-D10 (PFC)] = 0.0362, *p-val1mM[D1 (acute)-D10 (PFC)] = 0.0266, *p-valDepolarization[D1 (acute)-D10 (PFC)] = 0.0368. d Perifusion of T1D HPSs after high glucose and KCl stimulation. Y-axis, SI. e AUC at 1–10 min (3 mM glucose). f Left to right, AUC as in c (n = 1 sample from an individual T1D donor). g Perifusion of HPSs from additional donors after high glucose and KCl stimulation. Traces show responses at day 0 (immediately after slicing; green), d + 1 (after a 24 h rest; black) as well as day + 10 in transwells (blue) and PFC (red). Y-axis, SI. h AUC at 1–10 min (3 mM glucose). i Left to right, AUC as in c. One-way ANOVA post hoc Tukey HSD: **p-val16.7mM[d0-d1] = 0.0047, *p-val1mM[d0-d1] = 0.0023. g–i: n = 3 biologically independent samples from individual donors. j Glucagon perifusion of HPSs after stimulation with high glucose and KCl. Y-axis, SI. k AUC at 1–10 min (3 mM glucose). l Left to right, AUC as in c. j–l: n=3 biologically independent samples from individual donors. m Representative microphotograph of islet (backscatter) in a PFC-cultured slice at day 10, loaded with Fluo-4-AM. Right panels: stimulation with 30 mM KCl. Arrows point at three endocrine cells. n Traces of Ca2+ responses in cells after KCl stimulation, color-coded to those indicated in m. o Trace of β-cells responding to high glucose and KCl stimulation. p AUC of Ca2+ responses after high glucose and KCl stimulation. m–p: n = 3 biologically independent samples from individual donors. q Representative microphotograph of exocrine tissue upon stimulation with carbachol (10 µM). Arrows point at three acinar cells. r Color-coded traces for carbachol stimulation of the cells in q. s Traces of cells exposed to KCl after responding to carbachol, indicating non-endocrine phenotypes. t Left, amylase secretion after 10 pM CCK8 stimulation. Middle, AUC for 3 mM glucose/baseline stimulation. Right, AUC for 10 pM CCK8. q–t: n = three biologically independent samples from individual donors. Two-tailed t-test: *p-val3mM[Acute-d10TW] = 0.0307, ****p-val21days = 0.0450. u Left, amylase secretion after 10 µM carbachol stimulation. Middle, AUC for 3 mM glucose/baseline. Right, AUC for 10 µM carbachol (n = 3). For a–c, g–l, and o data are presented as mean ± SEM, while for p, t, u data are presented as mean ± SD. n = 1 chamber in d–f, hence no error bars. Each n further represents the mean of three technical replicates (three slices in one chamber in case of a–l, t–u). *p < 0.05; **p < 0.01; ***p < 0.005. Source data are provided in the Source Data file.

