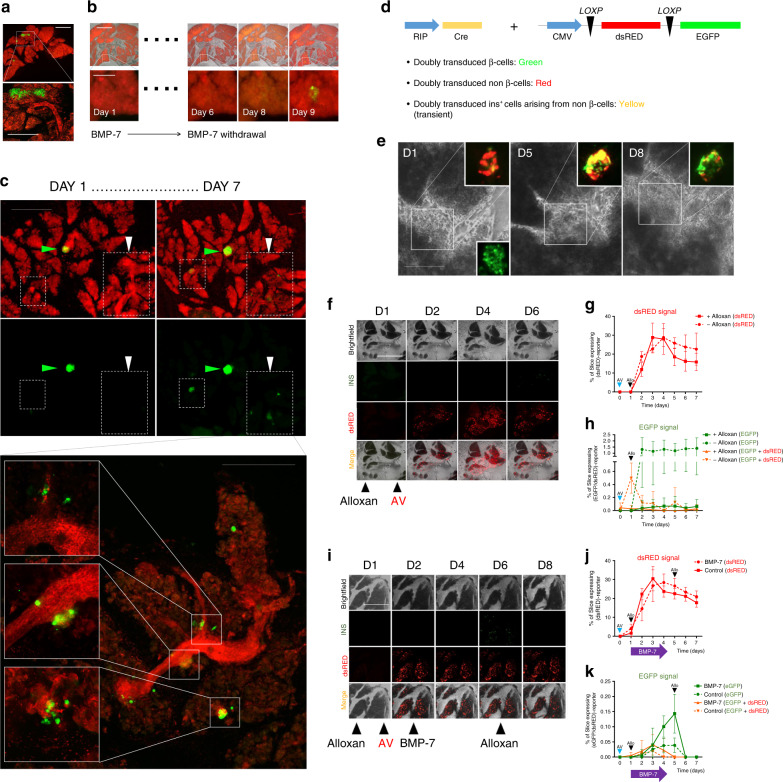
Fig. 4. Tracking of β-cell regeneration in murine pancreatic slices.
a Representative microphotograph of murine pancreatic slices from Ins2-Cre.mTmG mice, with EGFP+ insulin-producing cells (green) and all other cells tdTomato+ (red). An islet and adjacent duct are magnified in the inset. Scale 300 µm. b Following 5 days of BMP-7 stimulation, removal thereof leads to insulin+ cell formation at d9. Scale 300 µm (magnified insets: 50 µm). c Representative microphotograph of murine slices from Ins2-Cre.mTmG mice treated for 7 days with THR-123. Green arrow shows a pre-existing islet. After THR-123 removal, new insulin+ cells appear across the slice. Higher magnification confocal imaging of the same region (lower panel) shows new insulin+ cells sprouting from ducts. Scale 200 µm; magnified panel: 100 µm. d Reporter strategy involving the co-transduction with adenoviral RIP-Cre tracer and lox/dsRED/lox-EGFP reporter. Below are predicted outcomes depending on cell identity. e Representative microphotograph of CD1 mice-derived slices co-transduced as in d. BMP-7 is added for 5 days and then withdrawn. D1-d8 images show progressive appearance of insulin-expressing cells (green) from insulin– cells through an intermediate yellow (red + green) stage. Pre-existing islet-resident β-cells are EGFP-tagged within the first 48 h of transduction, as shown in d1 inset. Scale 50 µm. f Longitudinal imaging of CD1 mice-derived pancreatic slices transduced as in d. Alloxan was used to ablate β-cells at d1. No BMP-7 was added. Scale 500 µm. g Expression of dsRED protein in transduced control slices over 7 days in alloxan-treated (+) and untreated (−) slices. h EGFP expression and co-localization of EGFP + dsRED in co-transduced alloxan-treated (+) and untreated (−) slices over 7 days. i Representative microphotograph of CD1 mice-derived slices co-transduced as in d. Slices were also treated with alloxan to ablate β-cells and subsequently exposed to BMP-7 from day 2 to day 4. Scale 500 μm. j Quantification of dsRED expression in co-transduced, BMP-7-treated or control slices over 7 days in alloxan-exposed slices, showing no differences between groups. k Quantification of EGFP and co-localization of EGFP + dsRED (yellow) in co-transduced alloxan-exposed slices following treatment with BMP-7 (solid lines) or vehicle (dotted lines). Slices were challenged with alloxan a second time at d5, ablating new insulin+ cells. Scale 500 µm. For a–k, n = 5 biologically independent samples from individual mice. Data are presented as mean ± SD. Each n further represents the mean of three technical replicates, while plotted bars/lines are centered at mean. Source data are provided in the Source Data file.

