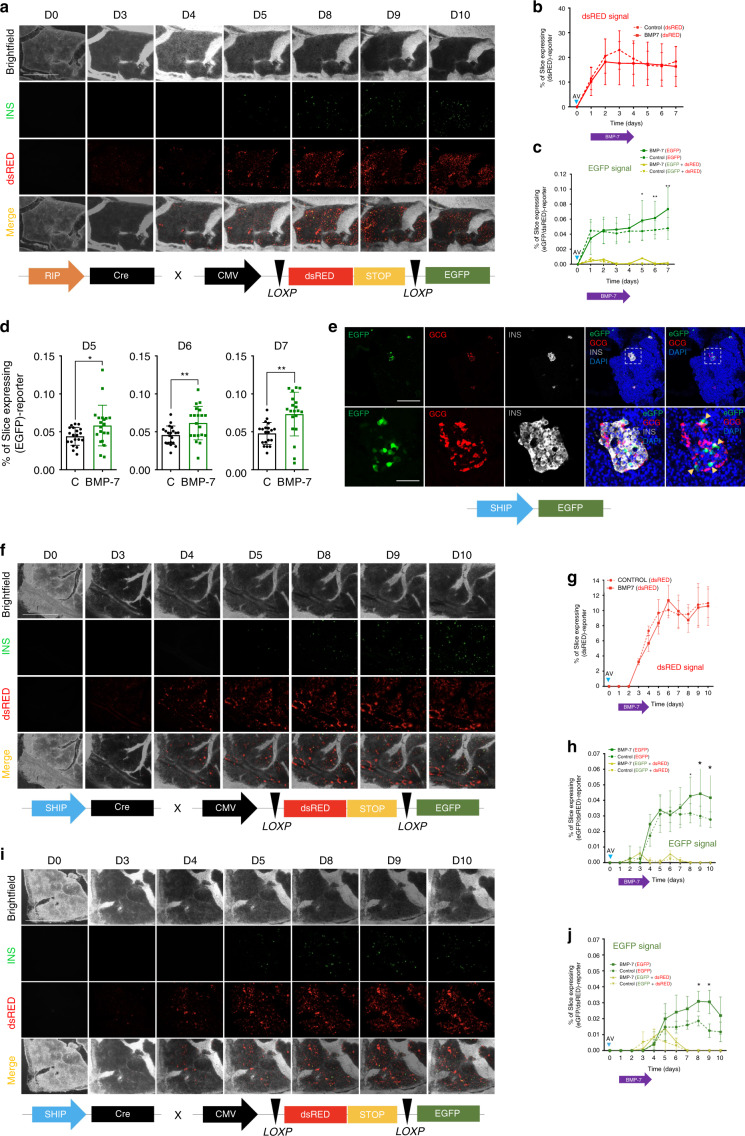
Fig. 5. Longitudinal tracking of β-cell formation in HPSs over extended culture.
a Longitudinal red-green immunofluorescence imaging of HPSs co-transduced with RIP-Cre and reporter adenoviruses (viral constructs in outline below). Scale 500 μm. b Quantification of dsRED expression in co-transduced BMP-7- (solid red line) or vehicle- (dotted red line) treated slices over time, showing no significant differences between groups. c Quantification of EGFP and co-localization of EGFP + dsRED (yellow) in co-transduced HPSs following treatment with BMP-7 (solid lines) or vehicle (dotted lines). Two-tailed t-test: *p-val5 days = 0.0363, **p-val6days = 0.0076, **p-val7days = 0.001. d Percentage of slice area expressing EGFP at d5, 6 and 7, as shown in c. Two-tailed t-test: *p-val5days = 0.0363, **p-val6days = 0.0076, **p-val6days = 0.0011. e Representative confocal immunofluorescence imaging of a region of a slice containing islet-resident β-cells tagged by a SHIP-EGFP adenovirus. HPSs were transduced with the SHIP-EGFP adenovirus, and slices were then fixed for immunostaining after 30 h. The lower row shows a magnified region for each channel of an islet with untagged α-cells (GCG, Glucagon+), whereas some β-cells (insulin+) are tagged by SHIP-EGFP. Scale, top row, 200 μm; bottom, 50 μm. f Longitudinal immunofluorescence imaging of HPSs co-transduced with SHIP-Cre and reporter adenoviruses (viral constructs in outline below). Scale 500 μm. g Quantification of dsRED expression in co-transduced BMP-7- (solid red line) or vehicle- (dotted red line) treated slices over 10 days in human pancreatic slices, showing no significant differences between groups. h Quantification of EGFP (green) and co-localization of EGFP + dsRED (yellow) in co-transduced human slices following treatment with BMP-7 (solid lines) or vehicle (dotted lines) over 10 days. For a–h, n = 3 biologically independent samples from individual donors were used. Two-tailed t-test: *p-val8days = 0.0278, **p-val9days = 0.0237, **p-val10days = 0.0144. i Longitudinal red-green immunofluorescence imaging of HPSs from a T2D donor co-transduced with SHIP-Cre and reporter adenoviruses (viral constructs in outline below panel) (n = 1 sample from an individual donor). Scale 500 μm. j Quantification of EGFP and co-localization of EGFP + dsRED (yellow) in co-transduced HPSs following treatment with BMP-7 (solid lines) or vehicle (dotted lines). The quantification of dsRED expression in co-transduced BMP-7- or vehicle-treated slices indicated no significant differences between the two groups (n = 1). Two-tailed t-test: *p-val8days = 0.039, **p-val9days = 0.02. For b–d, g, h, and j data are presented as mean ± SD. Each n further represents the mean of three technical replicates, while plotted bars/lines centered at mean. *p < 0.05; **p < 0.01; ***p < 0.005. Source data are provided in the Source Data file.

