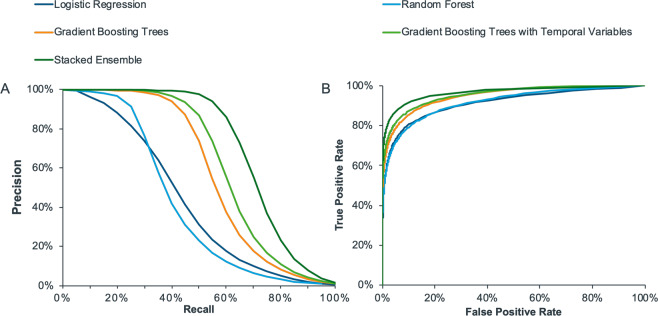
Figure 2.
Performance curves for logistic regression, random forest and gradient boosting trees (trained on the patient demographics and rate of occurrence of clinical events), gradient boosting trees (trained on the patient demographics, rate of occurrence of clinical events and temporal variables), and the stacked ensemble (trained to combine the predictions of all four learners). Panel A displays the precision-recall curves and panel B shows the receiver operator characteristic curves. Note that recall and true positive rate are both synonymous with sensitivity.

