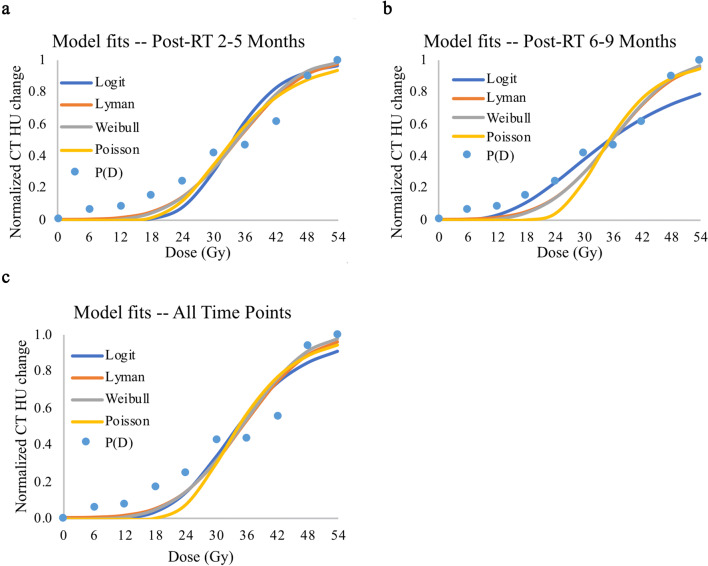
Figure 2.
NTCP modeling of radiation-induced effects to the lung: dose response data and model-fits for stereotactic body radiation therapy-induced injury of the lungs. Blue dots (P(D)) represent the radiation-induced effects, defined as the cumulative change in CT HU over all associated patients, normalized from 0 to 1 based on the maximal CT HU change seen at the particular time point. Blue, orange, gray, and yellow lines represent the Logit, Lyman, Weibull, and Poisson dose response models, respectively, fit to the data points. (a) The data and fits of six patients at 2–5 months after radiation therapy. These time points reflect radiation pneumonitis. (b) The data and fits of six patients at 6–9 months after radiation therapy. These time points reflect radiation-induced lung fibrosis. (c) The data and fits of all 12 patient data sets over all time points.

