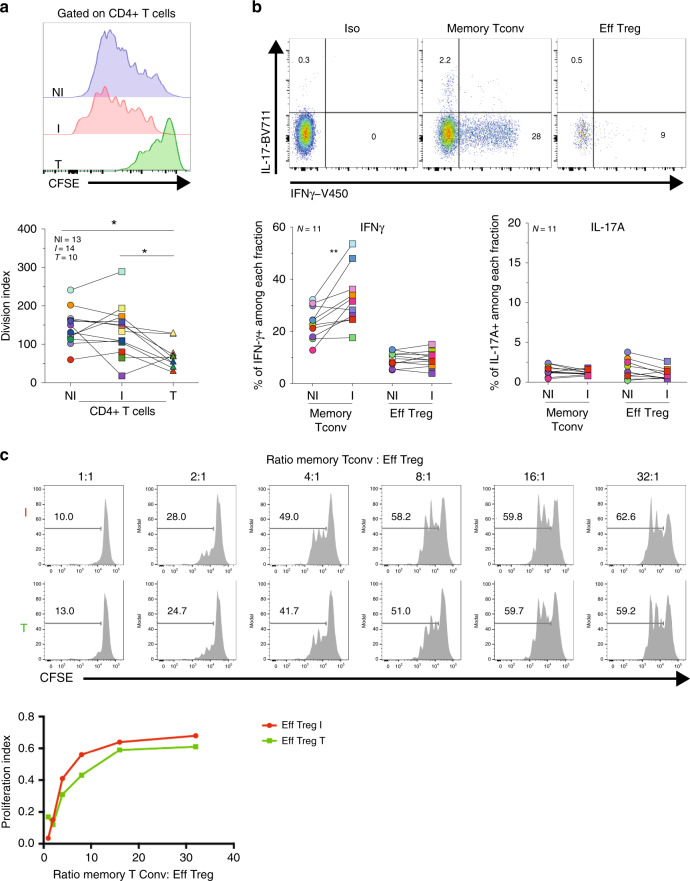
Fig. 3. Analysis of CD4+ Tconv and Treg function in TDLNs.
Axillary TDLNs cells and tumors were stained with CFSE, ex vivo stimulated with anti-CD3/CD28 beads for 96 h, and stained with CD3, CD4, CD8, and FOXP3. a Representative histograms showing CFSE dilution (left panels) and the division index (right panels) of CD4+ T cells in TDLNs and tumor (p = 0.0156 NI TDLN vs T; p = 0.0273 I TDLN vs T). Wilcoxon matched-pairs signed rank test. b Cell suspensions of TDLNs were ex vivo stimulated with PMA/Ionomycin for 4 h and stained for CD3, CD4, IFN-g, and IL-17A. Shown is a representative flow cytometric analysis (upper panel) and frequency (lower panel) of IFN-γ and IL-17 among gated CD4+ T cell subpopulations from TDLN (p = 0.0029 NI vs I TDLNs). c Evaluation of the suppression of autologous memory Tconv (CD4+ CD25−) proliferation by Tregs (CD4+ CD25high) sorted from fresh I TDLNs (I) and the corresponding primary tumor (T). Cells were cultured for 4 days in the presence of anti-CD3/CD28 beads. Histograms show the CFSE dilution (upper panel) and proliferation index of Tconvs in the presence or absence of Tregs at the indicated ratios (lower panel). Representative histograms (N = 1) from one out of two independent experiments with similar results. Wilcoxon matched-pairs signed rank test, *p < 0.05, **p < 0.01.

