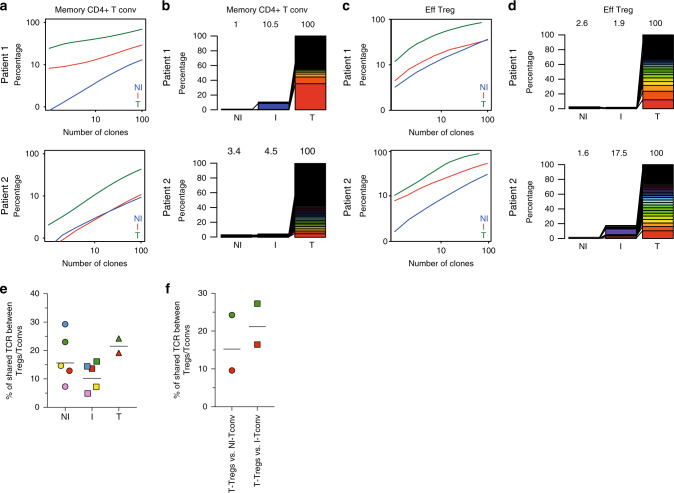
Fig. 5. Analysis of the TCR repertoire of CD4+ Tconvs and Tregs from NI and I TDLNs, and tumor.
Next-generation sequencing-based high-throughput TCR-β CDR3 analysis of bulk sorted T-memory CD4+ Tconvs and Tregs from matched NI and I TDLNs and the primary tumor. Graphs a–d display the TCR-β CDR3 clones of memory CD4+ Tconv a, b; or effector Tregs c, d. Graphs a, c show cumulative frequencies of from NI TDLNs (blue), I TDLNs (red), and the corresponding primary tumor (green), for two representative patients. Stacked bar chart b, d depict the usage frequencies of the top 100 tumor TCR-β CDR3 sequences and their distribution in matched NI and I TDLNs for two representative patients. Numbers in the graphs indicate percentage of shown TCR-β CDR3 sequences out of total TCR-β CDR3 sequences in the sample. e, f TCR repertoire overlap between Tregs and Tconvs. e Shown is the number (%) of unique TCRs shared between Tregs and Tconvs among all Treg clones in TDLN (N = 5) and tumor (N = 2). f Shown is the number (%) of unique TCRs shared between all tumor Tregs and Tconvs present in the NI or I TDLNs (N = 2). Each symbol is a sample, and samples from the same patients are in the same color.

