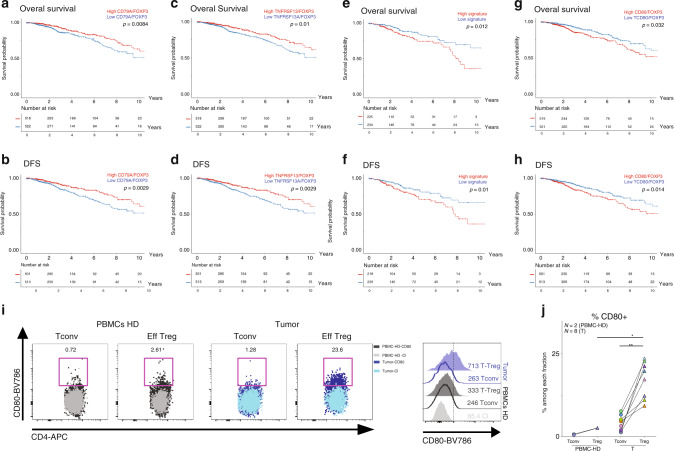
Fig. 7. Clinical outcome of differentially expressed genes normalized to FOXP3 expression.
a–h OS (upper panels) and DFS (lower panels) of patients with breast cancer stratified by “high” or “low” median intensity of the expression level of CD79, TNFRSF13B, “CD80, CCR8, and HAVCR2 signature” and CD80 normalized to FOXP3 expression, in TCGA breast cancer data set. i Representative flow cytometric analysis of CD80 expression on Tconv and Treg cells from HD PMBCs (left panels) or tumor (right panels) and representative histogram of CD80 MFI levels in the different subpopulations. j Frequency of CD80+ CD4+ Tconvs or Tregs in HD PBMCs (N = 2) or tumors CD45+ cells (N = 8). PBMC-Treg vs tumor-Treg p = 0.044. Mann–Whitney test. Tumor-Tconv vs tumor-Treg p = 0.0078. Wilcoxon matched-pairs signed rank test, *p < 0.05, **p < 0.01.

