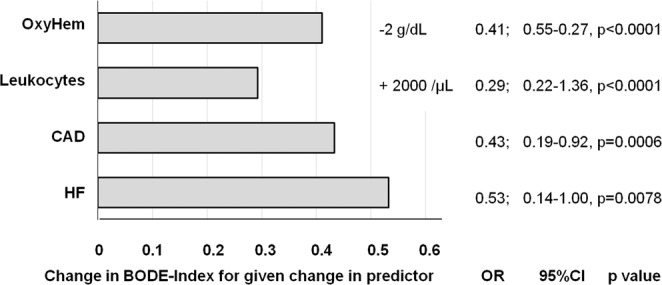
Figure 2.

The figure shows the absolute change of BODE-Index as derived from multiple linear regression analysis adjusting for sex, age, BMI and pack years for defined changes in four selected predictors. The change is given for a change in OxyHem by −2 g/dL, in WBC count by +2000/µL, or the presence of coronary artery disease (CAD) or heart failure (HF). Additionally, the numerical values of the changes in the BODE-Index, their 95% confidence intervals and the corresponding p values are shown.
