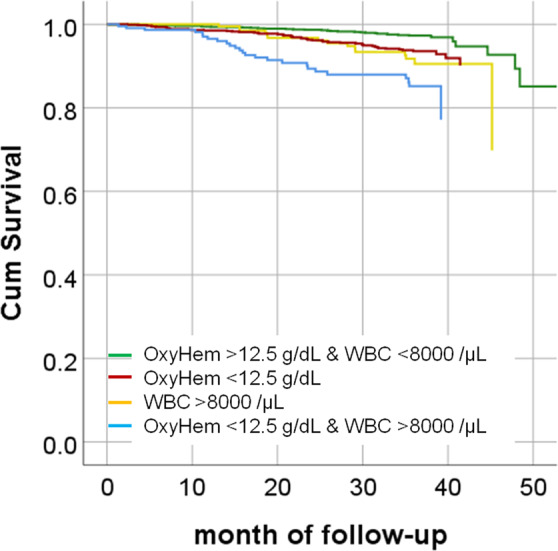
Figure 3.

Cox proportional hazards cumulative survival curves stratified for either OxyHem <12.5 g/dL, or WBC count >8000/µL. The corresponding hazard ratios for the binary OxyHem were 2.77 (95% CI: 1.85–4.15, p < 0.0001), and for the binary WBC count 2.33 (95% CI: 1.60–3.39, p < 0.0001 s), respectively. We additionally show the combined value in the sense, that either both measures were on the side of elevated risk, or both not, in order to demonstrate their combined value.
