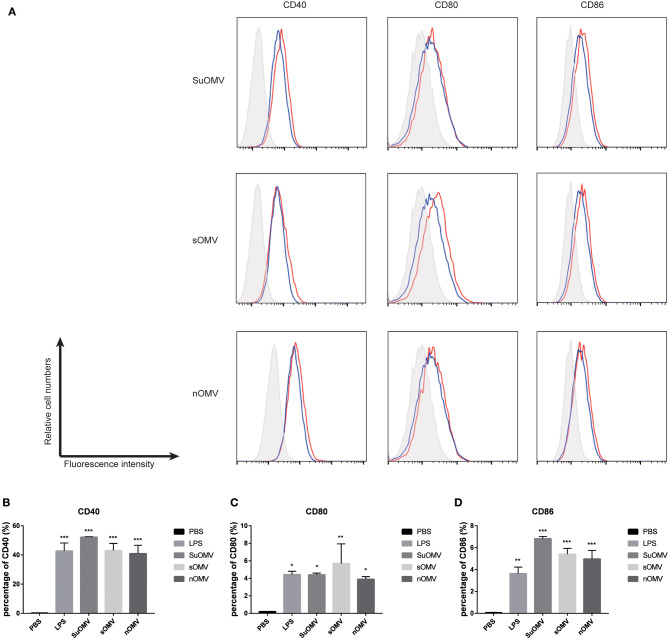
Figure 3.
The expression of maturation surface markers in BMDCs treated with the AbOMVs. BMDCs were incubated with PBS, LPS, SuOMV, sOMV, or nOMV for 48 h and analyzed for surface expression of CD40, CD80, and CD86. (A) A representative set of flow cytometry histograms. Black line: cells treated with PBS. Blue line: cells treated with LPS. (B–D) Normalized expression level of maturation markers. Data are expressed as mean ± S.D., n = 3. *P < 0.05, **P < 0.01, ***P < 0.001 compared with PBS control.

