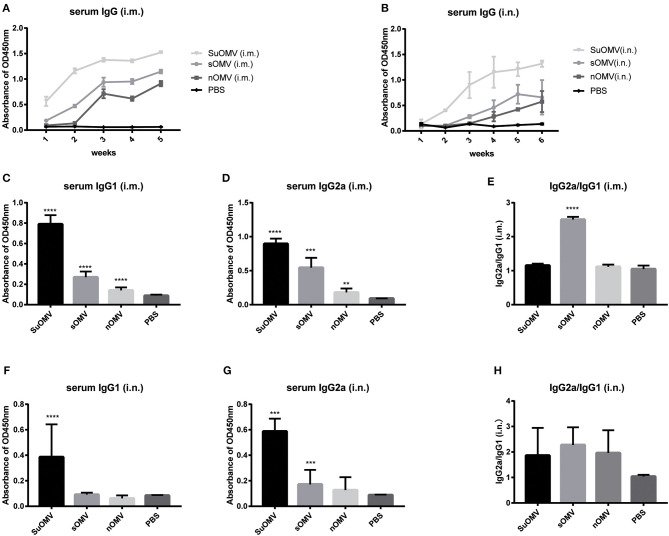
Figure 6.
Specific IgG and IgG subclasses profiles of mice immunized with either of the AbOMVs. BALB/c mice were immunized intramuscularly or intranasally with SuOMV, sOMV, or nOMV. The serum was collected every week until the time of challenge. (A,B) Specific serum IgG antibody titers were measured by ELISA. (C,D,F,G) The levels of specific IgG1 and IgG2a in serum samples were tested. (E,H) The IgG2a/IgG1 ratio (ratios>1 and <1 indicate a Th1 and Th2 polarized response, respectively). Data are expressed as mean ± S.D., n = 10. **P < 0.01, ***P < 0.001, ****P < 0.0001, compared with PBS control.

