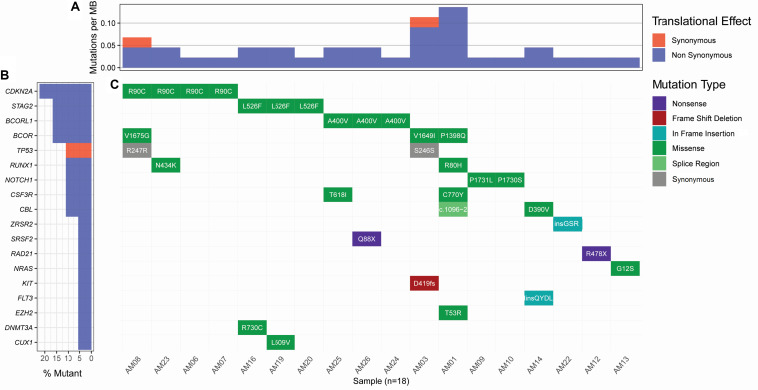
FIGURE 2.
Landscape of somatic mutations in AML. All the non-silent and synonymous somatic mutations are shown here. (A) The numbers of non-synonymous mutations are dominantly higher than synonymous mutations at the sequenced targeted regions. (B) Percent of samples with the somatic mutation in a gene. (C) Detail of somatic mutations in AML cases.

