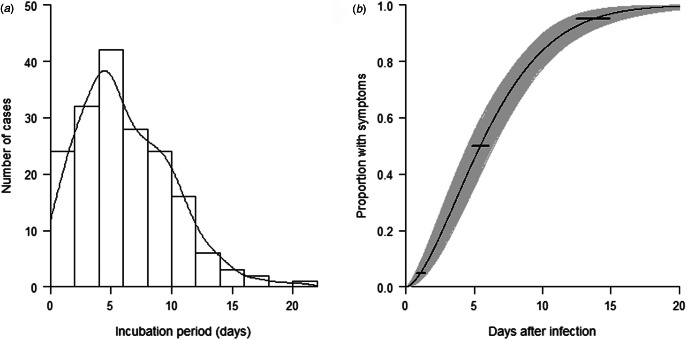
Fig. 1.
(a) Distribution of the observed incubation period of 178 COVID-19 cases. (b) Cumulative distribution function of the incubation period of COVID-19 under the Weibull distribution model. Horizontal bars represent the 95% CIs of the 2.5th, 50th and 97.5th percentiles of the incubation period distribution.

