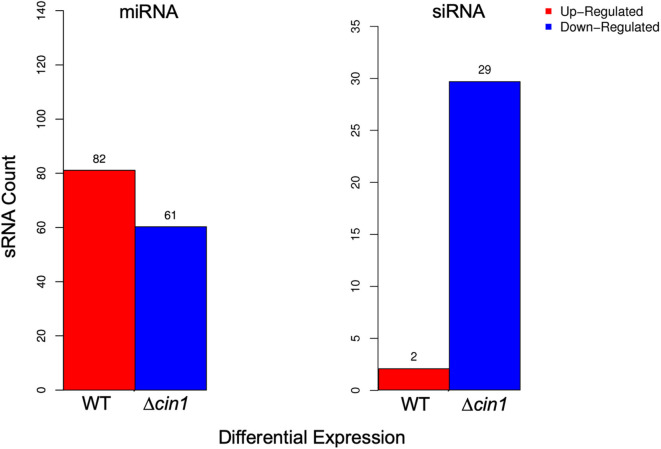
Figure 2.
Differential expression of extracellular small RNA (sRNA). Differentially expressed microRNA (miRNA) (left graph) and small interference RNA (siRNA) (right graph) between the wild-type (WT) and Δcin1 strains. Red color represents upregulation, and blue color represents downregulation. The expression level is calculated using TPM (transcripts per kilobase million; 't Hoen et al., 2008).

