FIGURE 3.
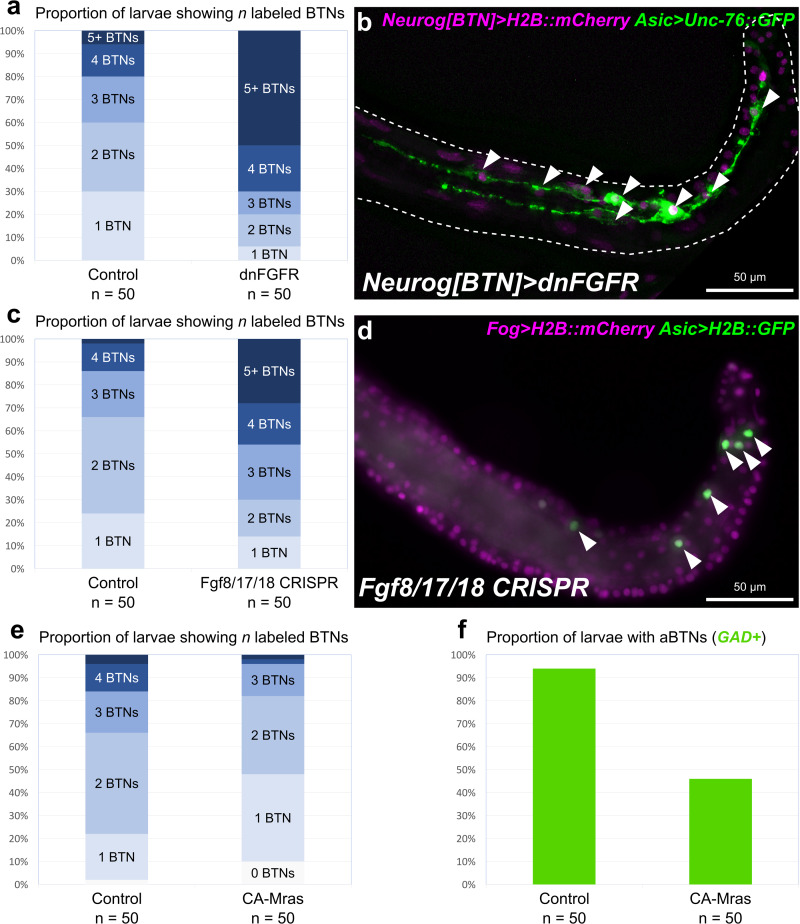
Perturbing FGF signaling in the BTN lineages. (a) Quantification of number of Asic > Unc-76:GFP + BTNs seen in larvae, showing expansion of BTNs upon dnFGFR overexpression. Only larvae with both Unc-76:GFP and BTN lineage-specific Neurog[BTN] > H2B:mCherry expression were scored. (b) Representative image of a larva showing many supernumerary BTNs (arrowheads) upon dnFGFR overexpression in the BTN lineages. (c) Quantification of BTN specification as in (a) but for tissue-specific CRISPR/Cas9-mediated knockout of Fgf8/17/18, using Asic > H2B:GFP as the BTN fate marker. (d) Representative image of a larva showing supernumerary BTN nuclei (arrowheads) upon tail tip-specific knockout of Fgf8/17/18. (e) Quantification of BTN specification as in (a) using Asic > Unc-76:GFP, but for overexpression of CA-Mras. In this case, H2B:mCherry + larvae with zero BTNs were also counted. (f) Quantification of larvae with GAD > Unc-76:GFP-labeled aBTNs upon CA-Mras overexpression.

