FIGURE 5.
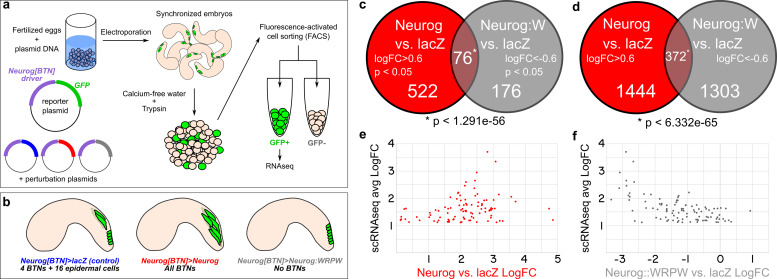
RNAseq-based analyses of Neurog function in BTNs. (a) Schematic of FACS + RNAseq approach used to profile BTNs. (b) Schematic of different conditions used to sort “control” BTN lineages and Neurog gain- or loss-of-function. (c) Non-proportional Venn diagram indicating number of genes in each condition showing statistically-significant (p < 0.05) differential expression (LogFC > 0.6 in Neurog vs. lacZ or <-0.6 in Neurog:WRPW vs. lacZ). Statistical significance (asterisk) was calculated using hypergeometric test. (d) Same analysis as in (c) but with p-value cutoff removed. Hypergeometric test was also used to measure statistical significance (asterisk). (e) Comparison of “avg LogFC” of top 98 BTN genes identified by single-cell RNAseq (Horie et al., 2018) to LogFC in Neurog vs lacZ, showing that all 98 are positively upregulated by Neurog. (f) Similar comparison as in (e) but to LogFC in Neurog:WRPW vs. lacZ, revealing that all but 7 of the top 98 BTN genes are downregulated by Neurog:WRPW. “Neurog:W” = Neurog:WRPW.

