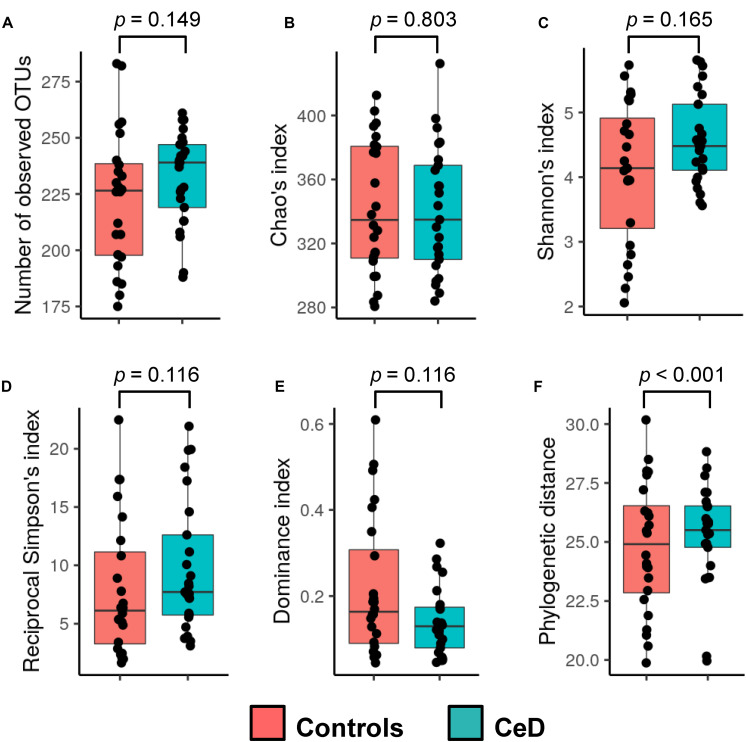
FIGURE 1.
Alpha diversity of the human milk microbiota. The observed richness (A), Chao’s index (B), Shannon’s index (C), reciprocal Simpson’s index (D), dominance index (E), and phylogenetic distance (F) were calculated for samples and compared between the study groups (cases and controls; see legend color). Non-parametric Wilcoxon rank-sum test (unpaired samples) was used to calculate differences among groups. The p-values resulting from the statistical assessment are shown.

