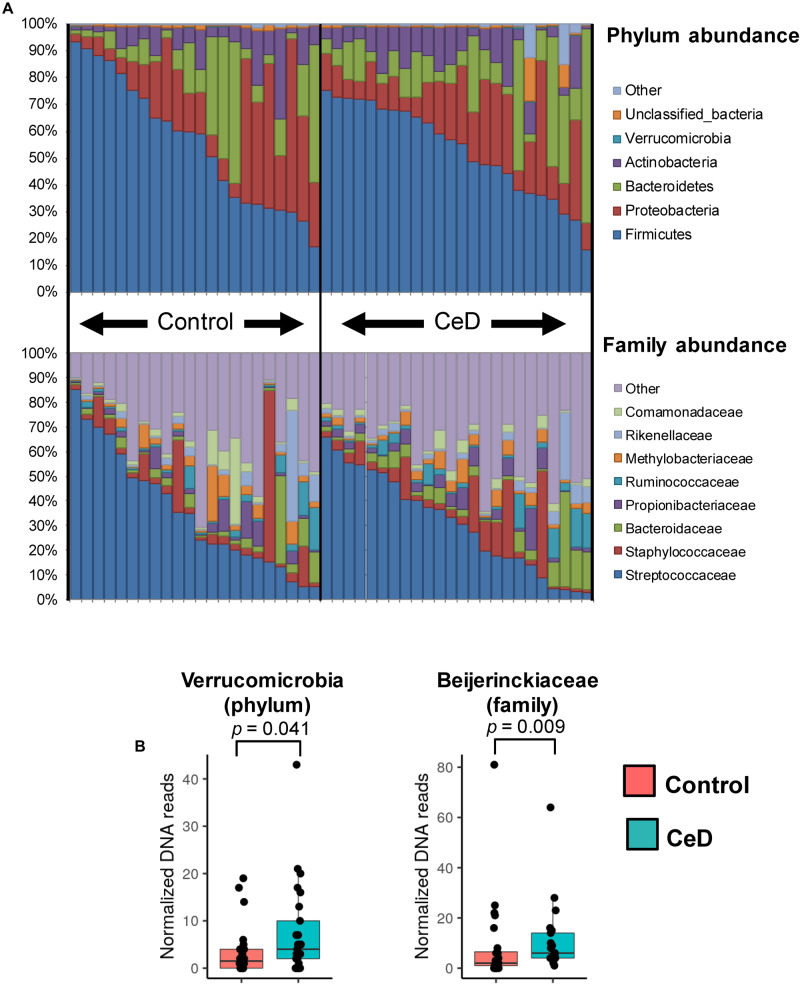
FIGURE 2.
Bacterial phyla and families distribution in human milk microbiota. (A) The phylum (top bar plot) and family (bottom bar plot) distribution in the whole set of samples analyzed show the most predominant members present in different human milk samples. (B) Taxonomic categories with differential abundance in the study groups (cases and controls). The distribution of DNA reads assigned to Verrucomicrobia phylum and Beijerinckiaceae family are presented in boxplots. In both cases the abundance of reads is higher in case samples (CeD developed in the offspring) than in controls (p = 0.041 and p = 0.009, respectively).

