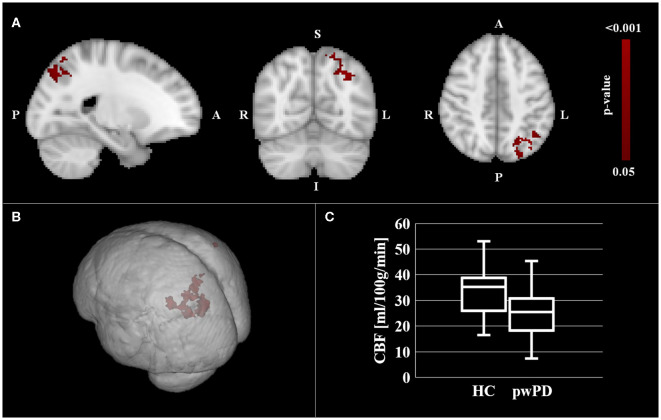
Figure 1.
CBF comparison between pwPD and HC. The areas showing significantly lower CBF (pFWE < 0.05) in pwPD with respect to HC are represented in MNI standard space (in red, A,B). The comparison of mean CBF within these areas between pwPD and HC is shown in (C). CBF, cerebral blood flow; FEW, family wise error; HC, healthy controls; pwPD, people with Parkinson's disease.

