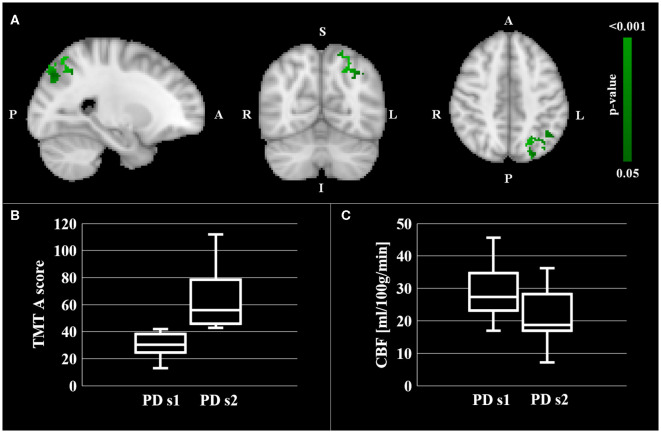
Figure 2.
CBF comparison between pwPD with a TMT A score below the median TMT A value (PD s1 subgroup) and pwPD with a TMT A score over the median TMT A value (PD s2 subgroup). Areas showing significantly lower CBF (pFWE < 0.05) in PD s2 subgroup are represented in MNI standard space (in green, A). The comparison of TMT A scores and mean CBF within these areas between the two pwPD subgroups are shown in the boxblots in (B,C), respectively.

