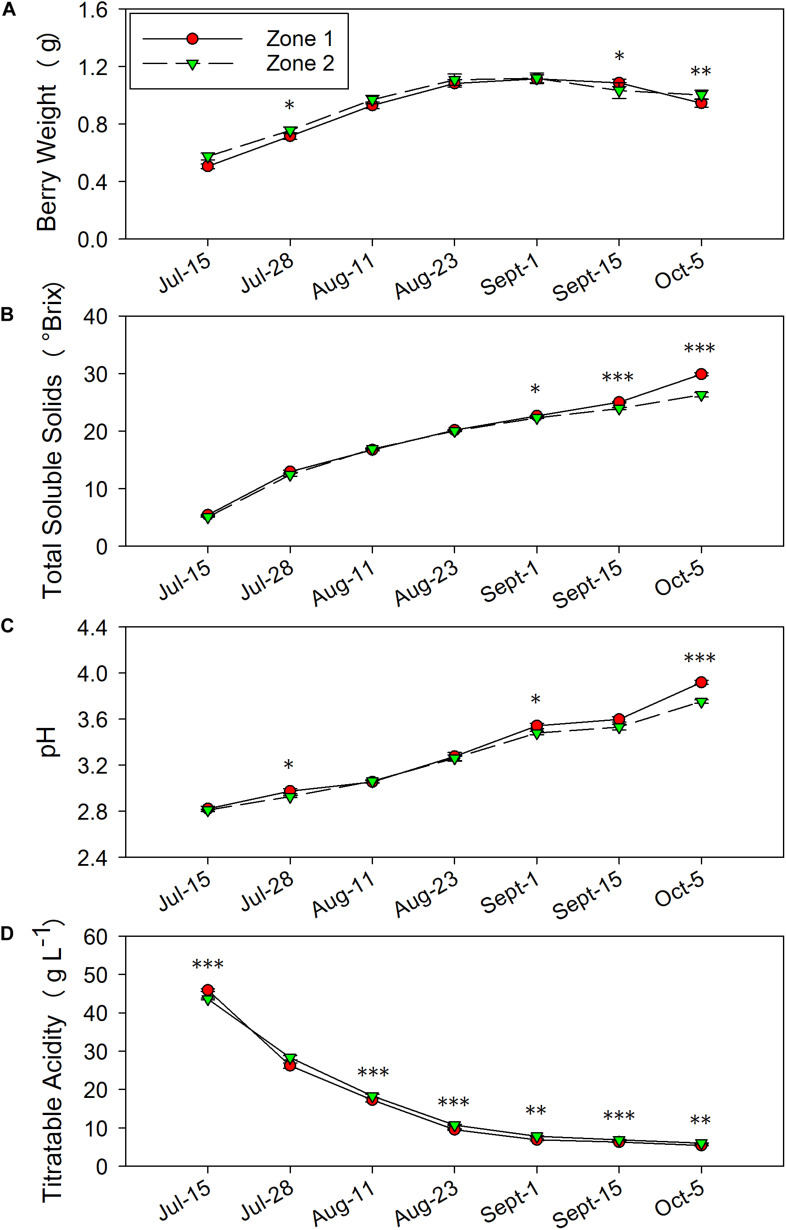
FIGURE 6.
Temporal development of grape berry primary metabolites between the two plant water status zones in 2016. (A) Berry weight, (B) total soluble solids, (C) pH, (D) titratable acidity. Error bars represent standard error of the mean. Asterisks represents significant levels p: ∗∗∗p < 0.001, ∗∗p < 0.01, ∗p < 0.05.

