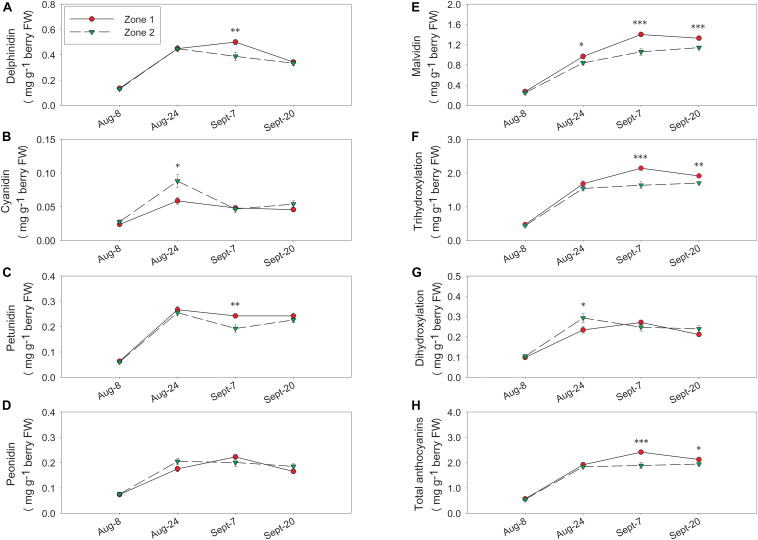
FIGURE 9.
Temporal development of grape berry anthocyanins between the two water status zones in 2017. (A) Delphinidins, (B) cyanidins, (C) petunidins, (D) peonidins, (E) malvidins, (F) tri-hydroxylation, (G) di-hydroxylation, (H) total anthocyanins. Error bars represent standard error of the mean. Asterisks represents significant levels p: ∗∗∗p < 0.001, ∗∗p < 0.01, ∗p < 0.05.

