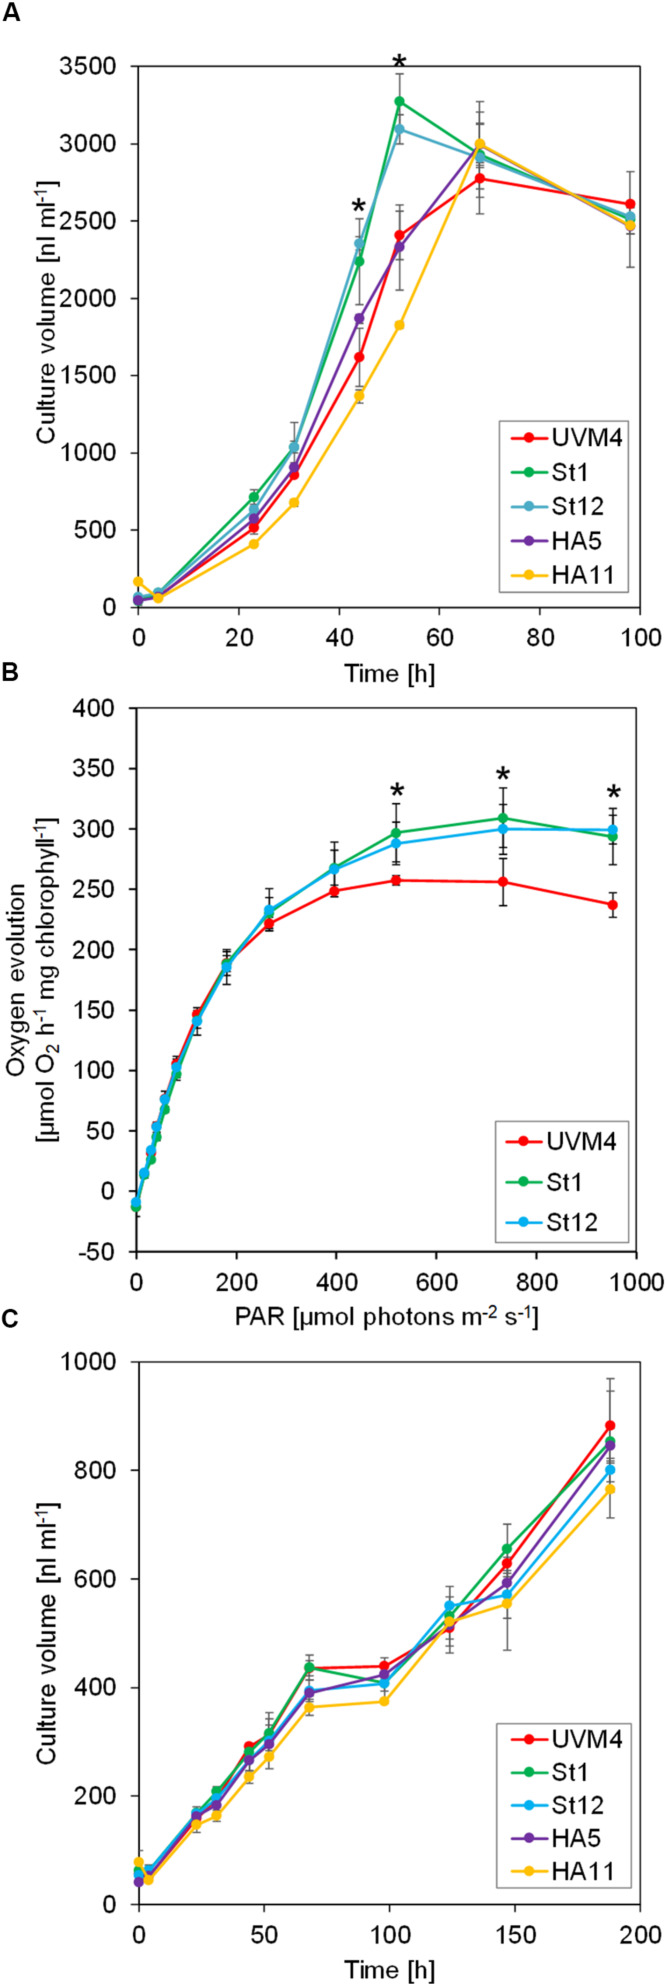
FIGURE 2.
Growth and light response curves of SBP1-overexpressing lines versus the UVM4 recipient strain. (A) Growth curves under mixotrophic conditions. Cultures were inoculated in TAP medium at a density of 3 × 10⁵ cells ml–1 and incubated on a rotatory shaker for 4 days at a light intensity of 150 μmol photons m–2 s–1. The culture volume (cell density × cell size) was determined with a Coulter counter. Values are the mean from three biological replicates, error bars indicate SD. Asterisks indicate significant differences to the UVM4 strain, p < 0.001 (one-way ANOVA with Dunnett’s multiple comparison test). (B) Light response curves. Cells were grown mixotrophically to mid-log phase and oxygen evolution at the indicated light intensities was measured on a Mini-PAM II with needle-type oxygen microsensor OXR-50. Values are the mean from three biological replicates, error bars indicate SD. Asterisks indicate significant differences to the UVM4 strain, p < 0.05 (one-way ANOVA with Dunnett’s multiple comparison test). (C) Growth curves under photoautotrophic conditions. Cultures were inoculated in HMP medium at a density of 3 × 10⁵ cells ml–1 and incubated on a rotatory shaker for 10 days at a light intensity of 150 μmol photons m–2 s–1. The culture volume (cell density × cell size) was determined with a Coulter counter. Values are the mean from three biological replicates, error bars indicate SD.

