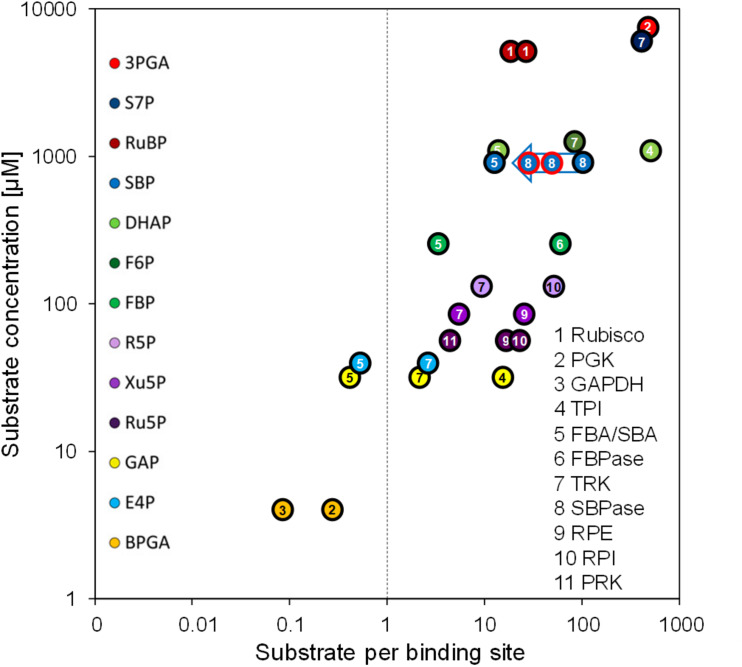
FIGURE 4.
Substrate per binding site versus substrate concentration. Substrate per binding site values of CBC enzymes are plotted against their substrate concentrations. Binding site abundances of the eleven CBC enzymes (numbered) were calculated based on the QconCAT data (Table 2). Substrates of CBC reactions are presented by different colors. Substrate concentrations were determined via LC-MS/MS by Mettler et al. (2014) in Chlamydomonas cells harvested 20 min after the light intensity was increased from 41 to 145 μmol photons m–2 s–1, i.e., when flux through the CBC is maximal. For enzymes that catalyze readily reversible reactions (TPI, FBA/SBA, TRK, RPI, RPE) the relation to product level is also shown. To facilitate comparison, the same numbering and color code as used in Mettler et al. (2014) was adopted. The blue arrow shows the estimates for substrates per binding site for the SBP1 overexpressing lines St1 and St12 (encircled in red). The two values for Rubisco are based on the slightly different quantification values for the large and small subunits (Table 2). A comparison with the values calculated by Mettler et al. (2014) using the emPAI approach is shown in Supplementary Figure 2.

