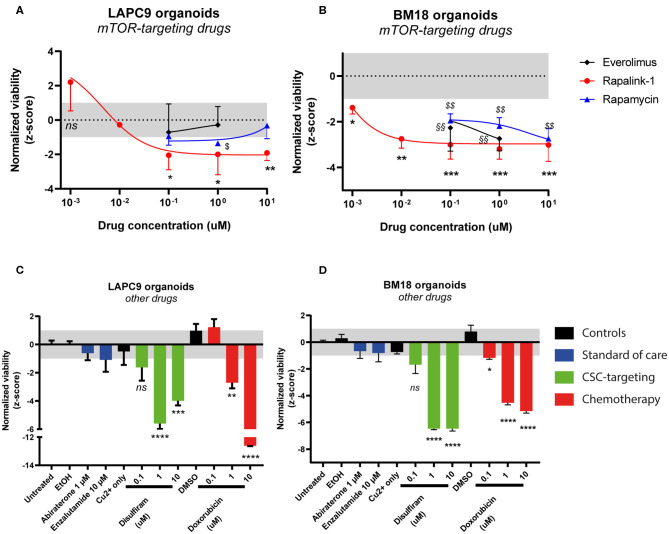
Figure 2.
Dose-response curves of LAPC9 (A) and BM18 (B) PDX organoids to mTOR-targeting drugs rapalink-1 (red circles), rapamycin (blue triangles), and everolimus (black diamonds) after 48 h treatment. Normalized viability values of organoids are plotted against log10 drug concentrations; N = 2–3. Viability assay of LAPC9 (C) and BM18 (D) PDX organoids after treatment for 48 h with other, non mTOR-targeting drugs. The grayed area in plots (A–D) corresponds to the expected distribution of the reference condition (untreated). Data were analyzed by one-way ANOVA, treated conditions were compared to vehicle (DMSO, EtOH for abiraterone treatment); N = 2–3. *p < 0.05; **, §§p < 0.01; ***p < 0.001; ****p < 0.0001.

