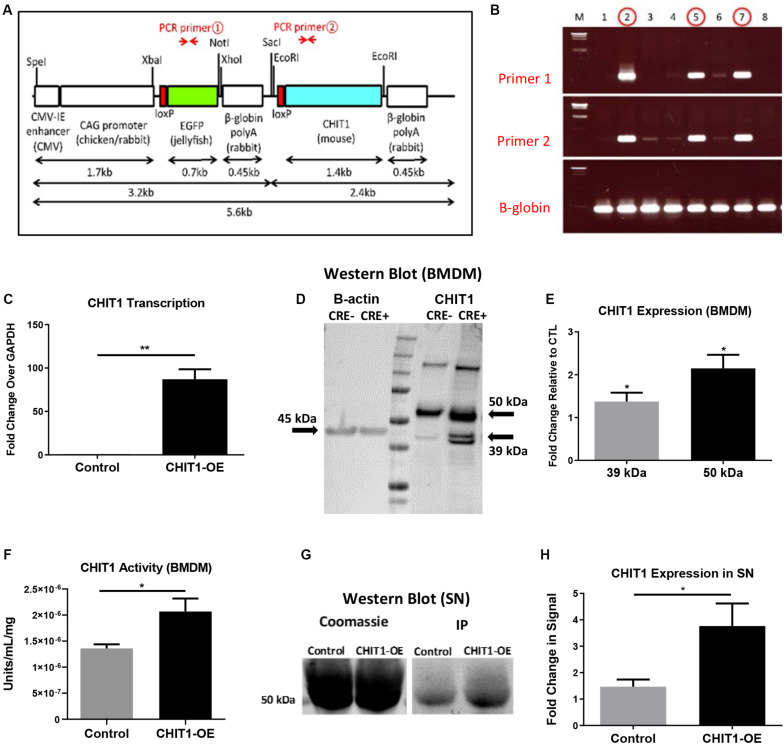
FIGURE 1.
(A) The transgene was designed with an EGFP stop sequence (green) that is removed in the presence of Cre recombinase. When Cre recombinase is expressed in lysozyme producing cells, the CHIT1 gene (blue) is constitutively expressed by macrophages. (B) Results from genotyping F0 mice indicate the presence of both primers and confirm transgene insertion. B -globin gene was used as internal control. (C) Transcription of CHIT1 mRNA was quantified using qPCR. cDNA was isolated from control and CHIT1-OE BMDM (P = 0.0059). (D) Western blot imaging of CHIT1 protein expression. Both the 50 kDa and 39–42 kDa isoforms were significantly increased in BMDM from CHIT1-OE mice compared to controls (P = 0.0245 and 0.0168 respectively). (E) Membranes after Western blot were imaged using Licor Odyssey CLx and analyzed with image studio software measurements reflect the fold change in florescence intensity. (F) CHIT1 activity was analyzed in BMDM from control (Cre-) and CHIT1-OE (Cre+). Liberated 4-MU emission was measured with a plate reader to determine enzymatic activity (P = 0.0305. (G) immunoprecipitation was performed on supernatants of BMDM harvested from CHIT1-OE mice and control animals. Coomassie staining of the membrane was used as a total protein control (P = 0.0330). (H) Analysis of Western blot images with image studio software showed a significant increase in CHIT1 protein expression. N = 3; *P<0.05; **P<0.01.

