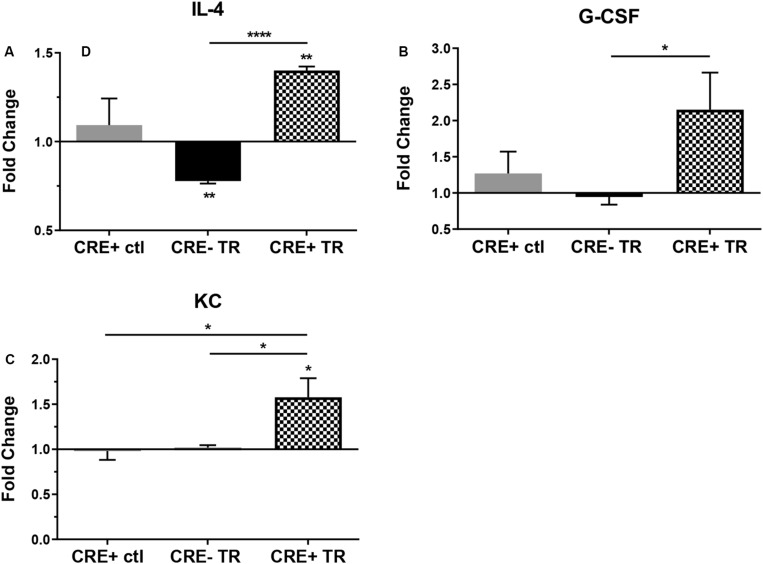
FIGURE 2.
Protein expression in CHIT1-OE BMDM and control BMDM was measured with a mouse cytokine array. Cell lysates were prepared from experimental and control BMDM which were untreated or exposed to 20 ng/mL IFN-γ + 100 ng/mL LPS for 8 h To induce pro-inflammatory activation. Between groups, treated BMDM exhibited a significant increase in protein expression between groups of (A) IL-4 (P<0.0001), (B) G-CSF(P = 0.0497), and (C) KC (P = 0.0426). N = 3 biological replicates, each run in duplicate. Values represent fold change in florescence. *P<0.05, ****P<0.0001.

