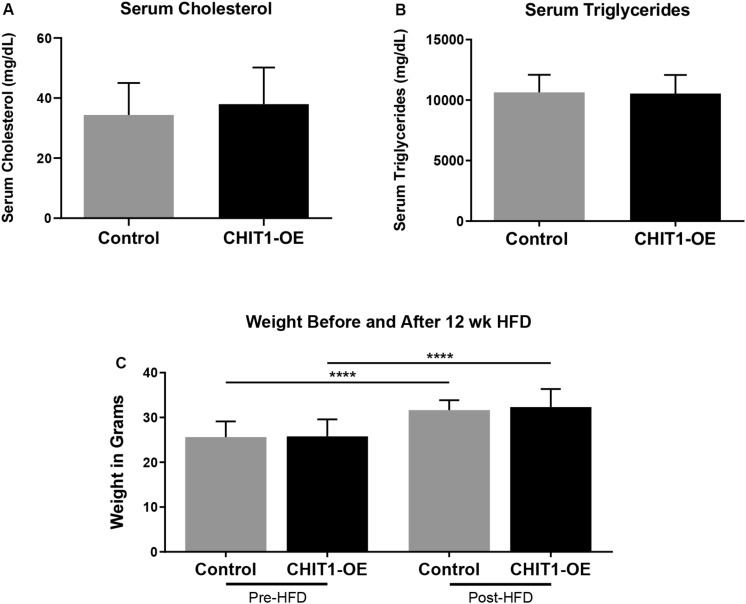
FIGURE 4.
(A,B) Measurements of serum cholesterol and triglyceride were taken after 12 weeks of HFD. Colorimetric and fluorometric analysis revealed no significant difference between control mice and CHIT1-OE mice. (C) Animals were weighed before and after initiation of HFD, which showed significant weight gain within groups over the 12 week period. However, animal weights were not significantly different when compared between CHIT1-OE and control groups (P < 0.0001). N = 24 (12 per group), ****P < 0.0001.

