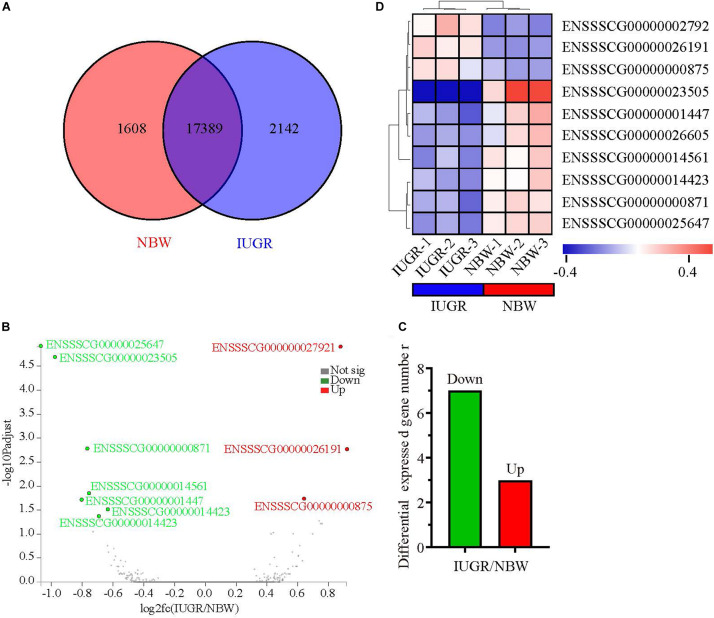
FIGURE 1.
Genome-wide distribution of differentially expressed genes between NBW and IUGR piglets at birth. (A) Venn diagram of expressed genes between NBW and IUGR piglets. (B) Volcano plots of the most significantly altered genes. (C) Heatmap diagram of differentially expressed genes between NBW and IUGR piglets. (D) Distribution of up-regulated genes in NBW and IUGR piglets.

