Figure 3.
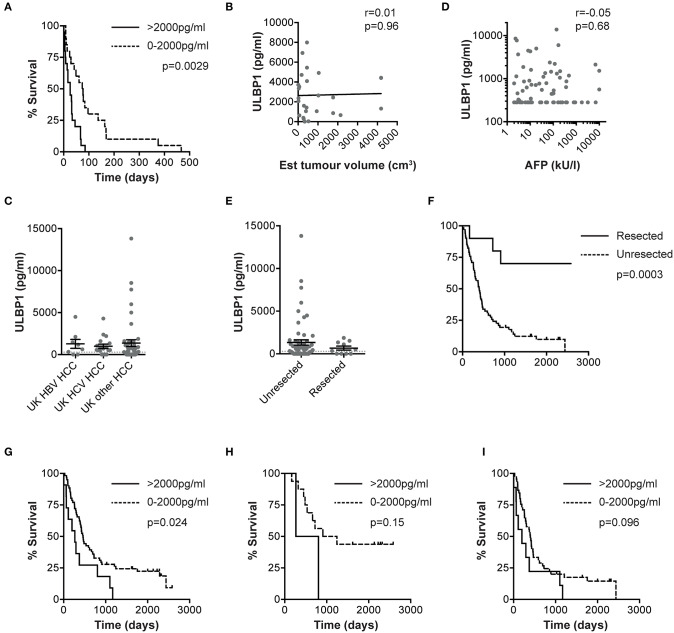
ULBP1 predicts outcome in HCC patients from the The Gambia and The UK. Kaplan-Meier curve comparing survival from the day of baseline clinical assessment between groups with serum ULBP1 above and below 2000 pg/ml in The Gambia (n = 37, A). Serum ULBP1 concentrations in individuals with HCC against estimated tumor volume (n = 27, B). Serum ULBP1 concentration in HBV-associated HCC (n = 8), HCV-associated HCC (n = 18) and HCC of other causes (n = 45), from a UK cohort (C). Serum ULBP1 concentration in UK patients against alpha fetoprotein (AFP, D). Serum ULBP1 concentration (E) and Kaplan-Meier curve of survival (F) in HCC patients that went on to resection (n = 10) and those whose tumors were not resected (n = 61). Kaplan-Meier curve comparing survival from the day of baseline clinical assessment between groups with serum ULBP1 above and below 2000 pg/ml in the UK whole cohort (n = 72, G). Kaplan-Meier curves comparing survival between groups with serum ULBP1 above and below 2000 pg/ml in UK patients with early stage (BCLC stage 0/A, n = 18, H) and late stage (BCLC B-D, n = 54, I) HCC. Mean and SEM of all groups shown. Levels of significance: *p ≤ 0.05; **p ≤ 0.005; ***p ≤ 0.001; ****p ≤ 0.0001. Mann Whitney-U test was used for comparisons of two unpaired groups, Spearman rank test was used for correlations of continuous variables. For Kaplan-Meier curves, p-values for difference in survival and hazard ratios were calculated by log-rank test.

