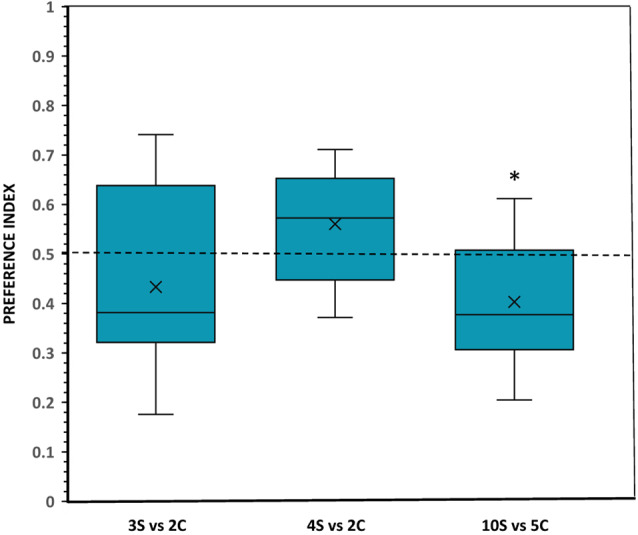
Figure 4.

Choice of angelfish in the different numerical contrasts when the size of the items was equal but the density (inter-item distance) was different: clustered (C) and scattered (S). The proportion of time (preference index) spent by test fish in the preference zone close to the food sets. Box plots show median (horizontal line in the boxes), 25% and 75% quartiles (boxes), and the highest and lowest values within the range of 1.5 times the respective quartiles (whiskers). Blades represent the mean proportion value. Values above 0.5 indicate a preference for the numerically larger, scattered food sets, whereas values below 0.5 indicate a preference for the numerically smaller, clustered food sets. A significant departure from the null hypothesis of no preference is indicated by asterisks, *p < 0.05.
