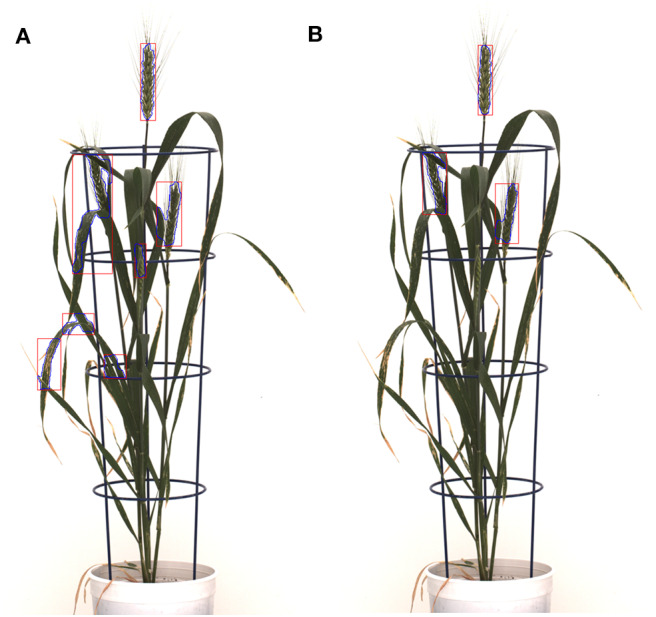
Figure 10.

The detected leaf artifacts in (A) result in a high spike area compared to (B) for the spike growth analysis. The segmented objects are represented with blue curves and red rectangular boxes; (A) the Qiongyan et al. method and (B) the proposed method.
