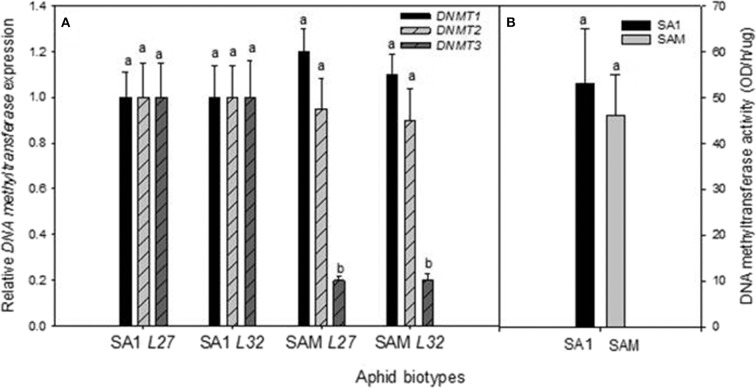
Figure 5.
(A) Comparison of the average relative expression (R mean) of DNMTs in South African RWA biotype heads. Fold changes in expression are shown relative to the SA1 samples, the expression of which was set at 1. DNMTs expression is presented when normalized against the reference genes L27 and L32, respectively, and the error bars indicate standard deviation. Different alphabetical letters indicate statistical significance (p ≤ 0.05). (B) DNA Methyltransferase protein activity (OD/h/μg) measured in South African RWA biotypes SA1 and SAM, with error bars indicating the standard deviation.

