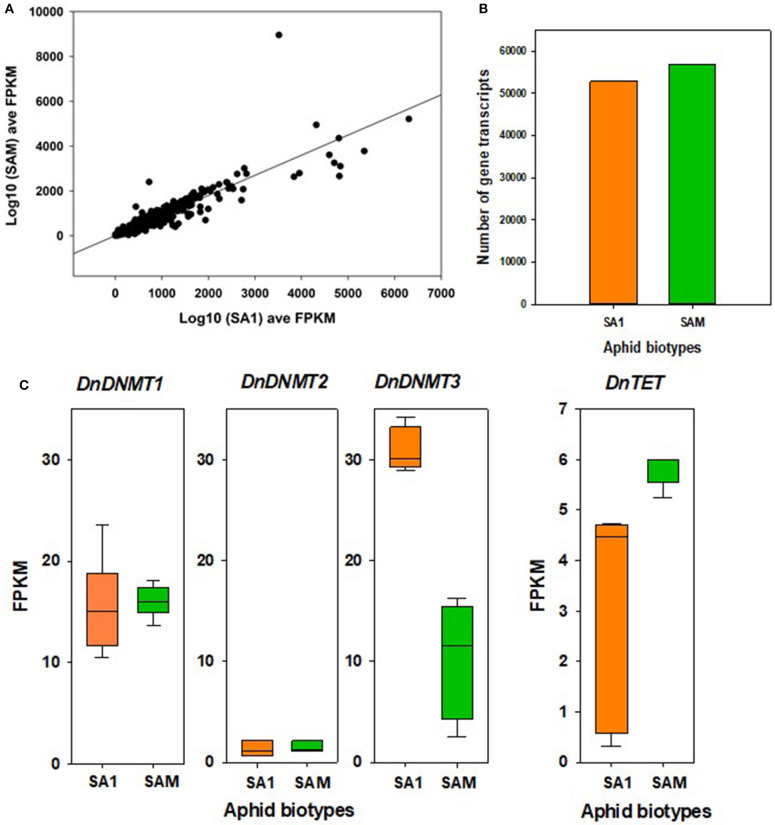
Figure 6.
Differential gene expression between RWA biotypes SA1 and SAM. (A) SA1 and SAM gene expression as log10 fragments per kilobase of transcript per million mapped reads (FPKM) average over three biological replicates for transcripts retained for differential expression (DE) analysis with edgeR (n = 64,214). Benjamini-Hochberg (BH) corrected p > 0.05 and absolute fold change [FC] > 1.5). (B) Comparison of number of transcripts expressed in SA1 and SAM. (C) Significant differences were observed in the expression of DnDNMT3 and DnTET in SA1 and SAM; edgeR; BH corrected p > 0.05 and absolute fold change [FC] > 1.5.

