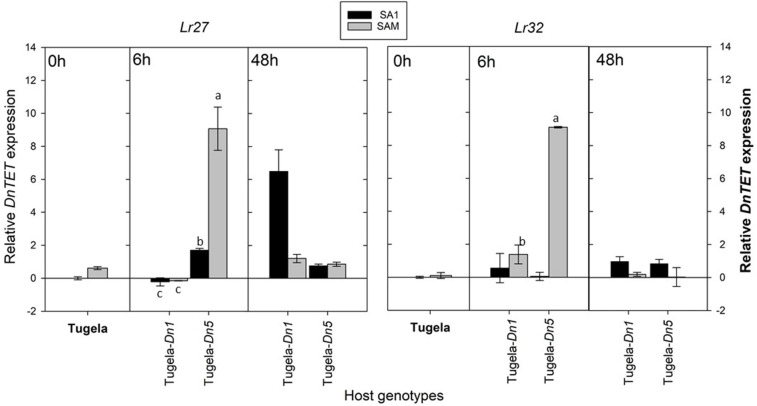
Figure 8.
A comparison of the average relative expression (R mean) of DnTET of South African RWA biotypes after transfer to different host plants after 6 and 48 h of feeding. Fold changes in expression are shown relative to the SA1 samples, the expression of which was set at 1. DnTET expression is presented when normalized against the reference genes L27 and L32, respectively, and the error bars indicate standard deviation. Different alphabetic letters indicate significant differences (p ≤ 0.05).

