Figure 9.

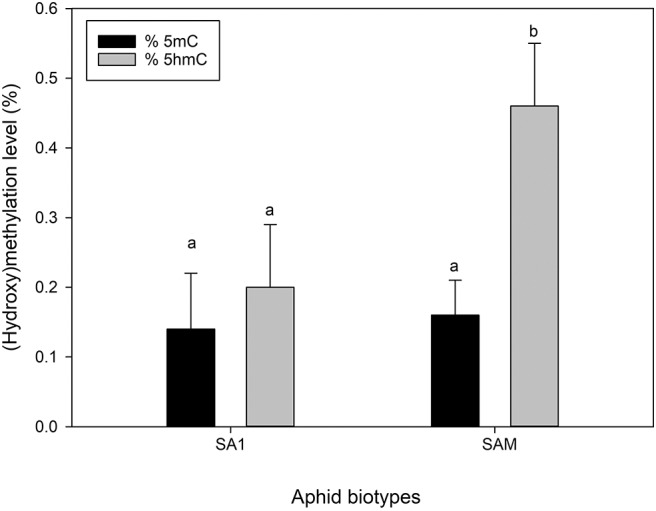
Comparison of global 5 mC (black) and 5 hmC (gray) levels of the South African RWA biotypes. The error bars indicate standard deviation and different alphabetic letters indicate significant differences (p ≤ 0.05).

Comparison of global 5 mC (black) and 5 hmC (gray) levels of the South African RWA biotypes. The error bars indicate standard deviation and different alphabetic letters indicate significant differences (p ≤ 0.05).