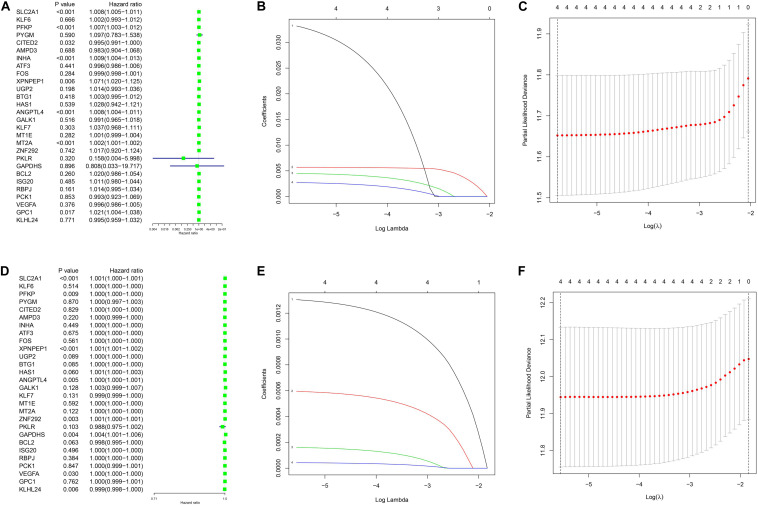
FIGURE 1.
Univariance Cox regression and lasso regression results. (A–C) The TCGA-LUAD cohort results. (D–F) The GSE68465 cohort results. (A,D) show the univariance Cox regression analysis. (B,E) show the lasso regression analysis. (C,F) show the partial likelihood deviance for the lasso regression.

