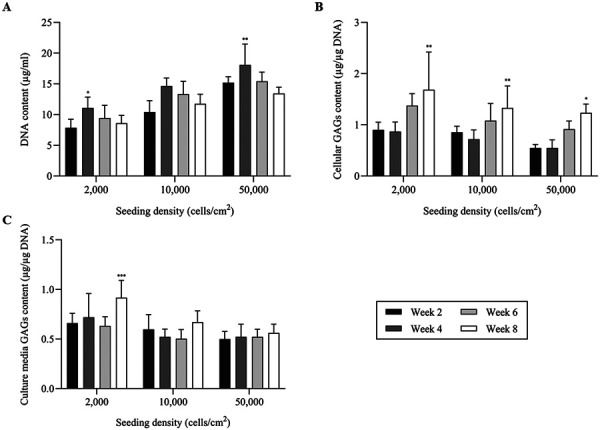
Fig. 4.

Biochemical analysis of long-term monolayer cultured chondrocytes seeded with different initial densities; 0.2 × 10⁴, 1.0 × 10⁴ and 5.0 × 10⁴ cells/cm2 and maintained over a period of 8 weeks. The analysis was performed every 2 weeks during the cultured period. (A) Quantification of DNA content in cell lysate by Hoechst assay, which indicates the highest DNA content at week 4, then steadily decreases until week 8. (B, C) Quantification of glycosaminoglycans (GAGs) content (normalized with DNA content) by dimethylmethylene blue (DMMB) assay in cell lysate and culture media, respectively. The data are represented as the mean ± SD (*P<0.05, ** P<0.01 and *** P<0.001).
