Figure 5.
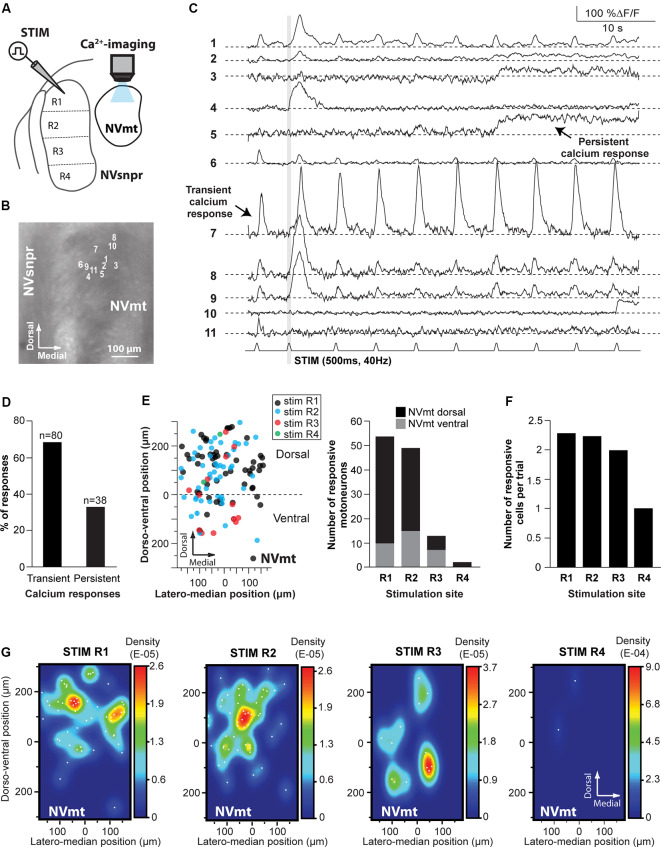
Distribution of motoneurons activated by stimulation of different divisions of NVsnpr. (A) Schematic drawing of the brainstem slice preparation and the experimental conditions used. (B) Photomicrograph showing the position of the responsive cells in NVmt following electrical stimulation of the dorsal NVsnpr and their Ca2+-responses in panel (C). Some showed a transient response at every stimulation pulse (e.g., trace 7), while others had persistent responses (e.g., trace 5) or only one large transient response with or without a few much smaller ones afterward. Gray vertical line indicates the length of the train of stimulation. (D) Percentage of NVsnpr cells presenting transient vs. persistent responses. (E) Left: distribution of all responsive motoneurons according to the site of electrical stimulation in NVsnpr. Right: vertical bars chart reporting the number of responsive motoneurons according to the site of electrical stimulation in the NVsnpr. (F) Vertical bars chart reporting the number of responsive motoneurons per trial according to the site of electrical stimulation in the NVsnpr. (G) Heatmaps illustrating the location of responsive motoneurons within the NVmt according to the site of electrical stimulation in the NVsnpr. Abbreviations: Stim, stimulation; NVsnpr, trigeminal main sensory nucleus; NVmt, trigeminal motor nucleus.

