Figure 3.
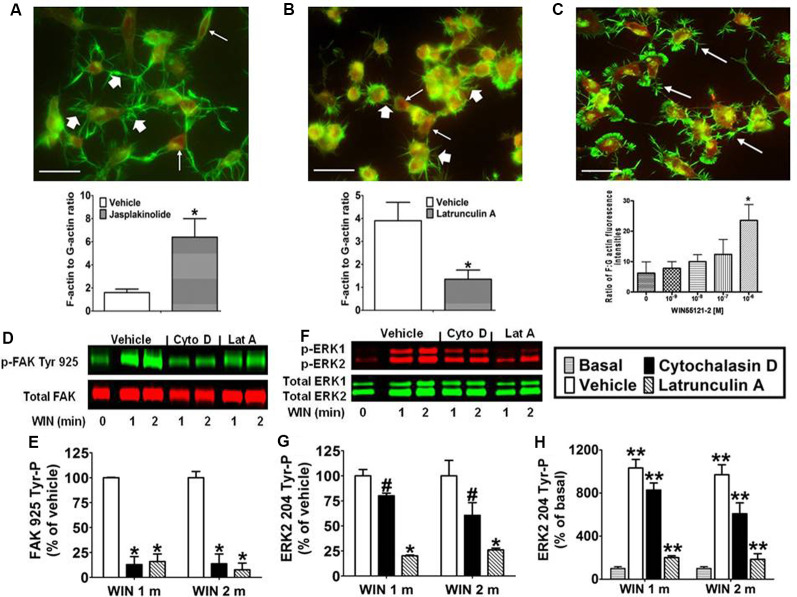
CB1-stimulated FAK phosphorylation at tyrosine 925 and ERK2 phosphorylation at tyrosine 204 requires an intact actin cytoskeleton in N18TG2 cells. (A–C) Cells grown on glass coverslips were treated with jasplakinolide (4 nM, 10 min), latrunculin A (0.01 μg/ml, 30 min), or WIN55212-2 (1–1,000 nM, 20 min). Actin remodeling was detected by fluorescent double labeling of F-actin (Alexa Fluor 488 phalloidin, short white arrow) and G-actin [Texas Red DNase I, long white arrow; neurite outgrowths, white arrow in panel (C)]. F-actin to G-actin ratios were quantified from green and red staining intensities using Image Pro 4.5 software. *p < 0.01 indicates significantly different from vehicle-treated using Student’s t-test. (D–H) Cells were pretreated with cytochalasin D (2 μM, Cyto D) or latrunculin A (1 μM, Lat A) before treatment with 0.01 μM WIN55212-2 (WIN) for 1 or 2 min (m) at 37°C. Cell lysates were analyzed using western blots and representative blot images and analysis of FAK 925 Tyr-P (normalized to total FAK levels) and ERK2 204 Tyr-P (normalized to total ERK2 levels) are shown. Data are reported as mean ± SEM of (E) % of vehicle-treated FAK 925 Tyr-P at the same time point, (G) % of vehicle-treated ERK2 204 Tyr-P at the same time point, and (H) % of basal/time 0 ERK2 204 Tyr-P from three separate experiments. Significance was assessed using One Way ANOVA followed by Dunnett’s multiple comparisons posthoc test [#p < 0.05, *p < 0.01 indicates significantly different from vehicle-treated (at the same time point); **p < 0.05 indicates significantly different from basal/time 0]. For each dataset in panels (D–H), cells were cultured and experiments were completed on at least three separate occasions.

